

Cloning and Expression of Human Interleukin 2 (IL-2) in E. coli and its Antitumor Activity


Cloning and Expression of Human Interleukin 2 (IL-2) in E. coli and its Antitumor Activity
Qurrat ul Ain Shafique1, Sana Batool2, Hanfa Ashfaq2, Asima Tayyab2, Roquyya Gul3 and Mahjabeen Saleem1*
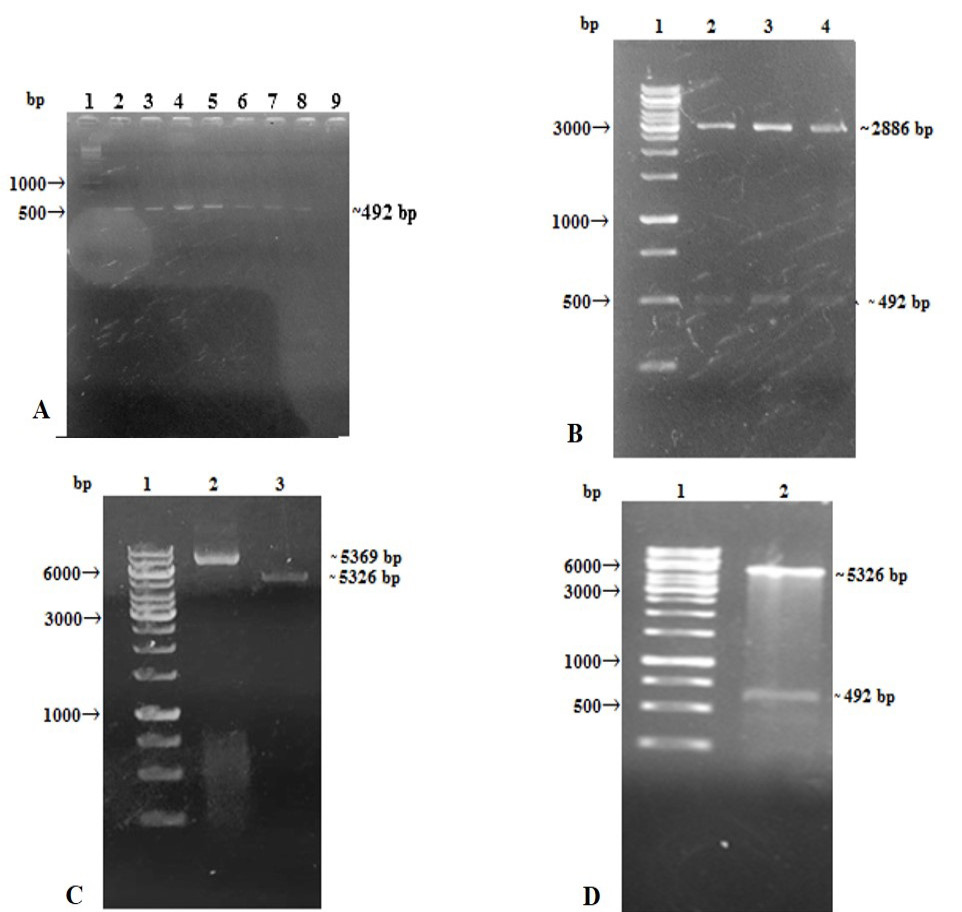
Cloning of IL-2 gene in expression vector. A, amplification of IL-2 gene by PCR with different MgCl2 conc. and temperature gradient, Lane 1: 1kb DNA ladder, Lane 2-5: 1.5, 2.0, 2.5 and 3.0mM MgCl2 at 62°C, Lane 6-9: 1.5, 2.0, 2.5 and 3.0 mM MgCl2 at 65°C. B, restriction digestion of pTz57R/IL-2 recombinant plasmid, Lane 1: 1kb DNA ladder, Lane 2-4: Double digested plasmid with EcoRI/XhoI restriction enzymes. C, restriction digestion of pET28a(+) isolated from DH5α, Lane 1: 1kb DNA ladder, Lane 2: Uncut pET28a(+), Lane 3: Cut pET28a(+) by using EcoRI and XhoI restriction enzymes. D, restriction digestion of recombinant pET28a (+)/IL-2, Lane 1: 1kb DNA ladder, Lane 2: Restriction digestion showing two fragments i.e. ~5326 bp pET28a and ~492bp IL-2.
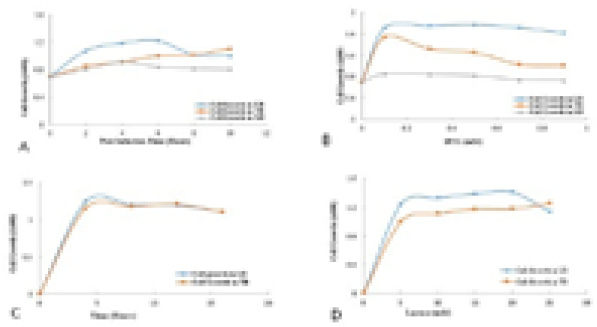
Effect of different parameters on growth of E. coli (BL21 codon plus) cells transformed with pET28a (+)/IL-2. A, Effect of post induction time after induction with 0.5mM IPTG in different growth media. B, Effect of IPTG conc. in different growth media. C, Effect of time in different auto inducing media after induction with 5mM Lactose. D, Effect of lactose concentration in different auto-inducing media after induction with 5, 10, 15, 20 and 25mM Lactose concentrations, the curves represent growth patterns in different media, ♦ (LB), ■ (TB) and ▲M9.


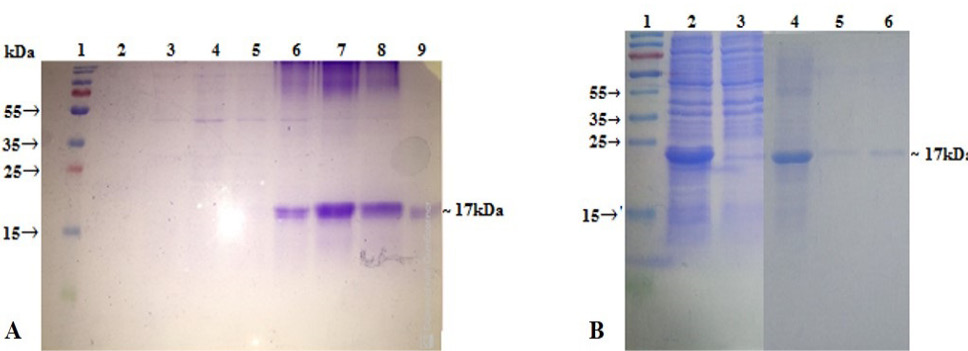
15% SDS gel showing. A, fractions of denaturing immobilized metal affinity chromatography (IMAC); Lane 1: Pre-stained protein marker, Lane 2-9: 50- 500mM fractions. B, stages of purification of IL-2; Lane 1: Pre-stained Protein marker. Lane 2, Pellet; Lane 3, Supernatant; Lane 4, Solubilized inclusion bodies (IBs); Lane 5, IMAC purified IL-2; Lane 6, Renatured IL-2 after dialysis.

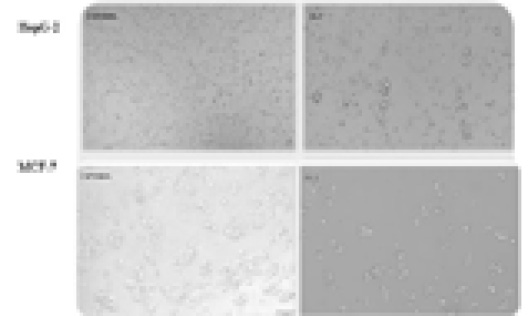
Change in morphology of HepG-2 and MCF-7 cells after treatment with varying concentrations of IL-2 (250ng-10,000ng) for 48 h. (Magnification=10X, Resolution= 200um).

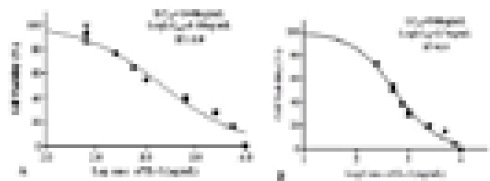
MTT assay results showing. A, viability (%) of HepG2 cell lines after treatment with varying concentrations of IL-2 (250ng-10,000ng) for 48 h. B, viability (%) of MCF-7 cell lines after treatment with varying concentrations of IL-2 (250ng-10,000ng) for 48 h.

