

Complete Mitochondrial Genome of Turdus merula (Aves: Passeriformes: Turdidae) and Related Species: Genome Characteristics and Phylogenetic Relationships


Complete Mitochondrial Genome of Turdus merula (Aves: Passeriformes: Turdidae) and Related Species: Genome Characteristics and Phylogenetic Relationships
Zhenkun Zhao1,2, Ziniu Alimo2, Xinyue Zhao2, Haifen Qin1, Buddhi Dayananda3, Lichun Jiang1,2* and Wei Chen4*
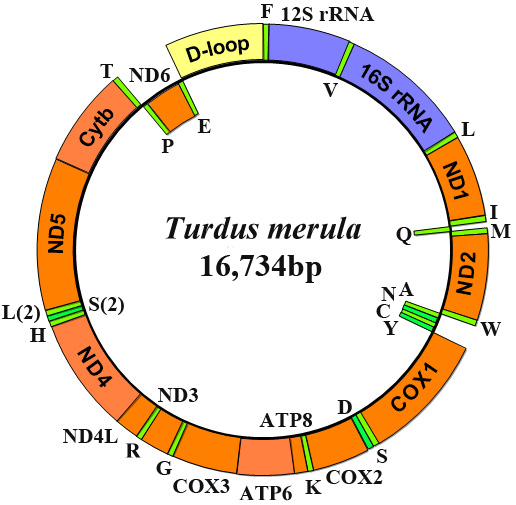
Gene organization of the T. merula mitochondrial genome. All 37 genes are encoded on both strands. Genes for proteins and rRNAs are shown with the standard abbreviation. Genes for tRNAs are designated by a single letter for the corresponding amino acid with two leucine tRNAs and two serine tRNAs differentiated by numerals.

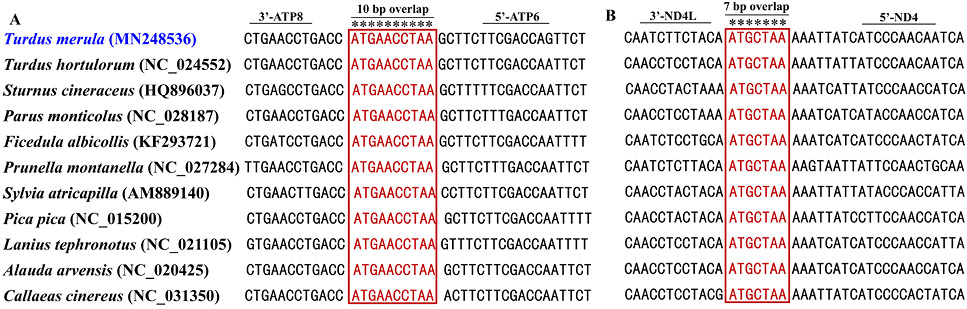
Sequence alignments of ATP8/ATP6 and ND4L/ND4 of passerine birds. The boxed nucleotides indicate the 10 bp (ATGAACCTAA) and 7 bp (ATGCTAA) highly conserved overlaps.

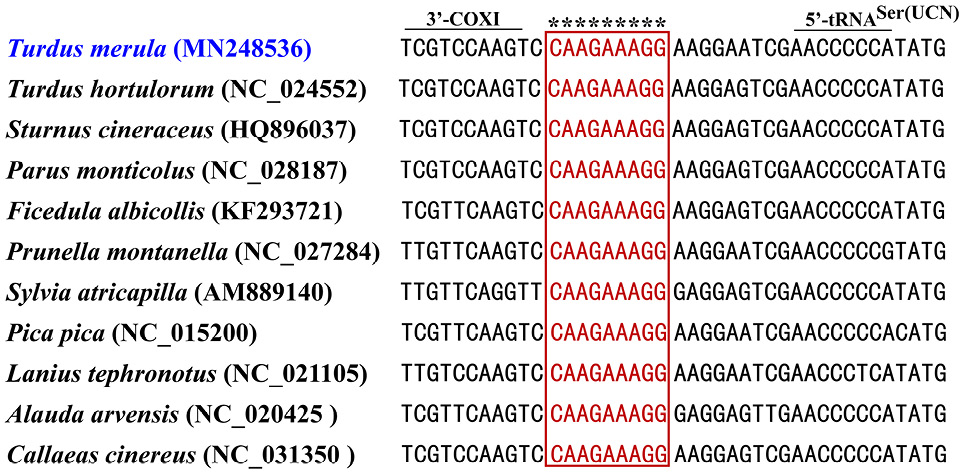
Sequence alignment of the space region between COXI and tRNASer (UCN) of passerine birds. The boxed nucleotides indicate the ‘CAAGAAAGG ‘ highly conserved motif. “ATGAACCTAA” between ATP8 and ATP6, and “ATGCTAA” between ND4L and ND4, and “CAAGAAAGG”.
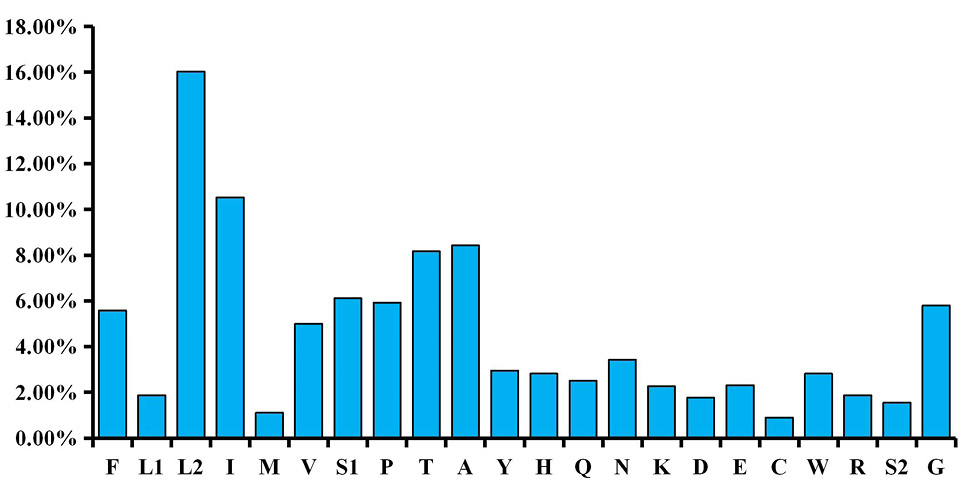
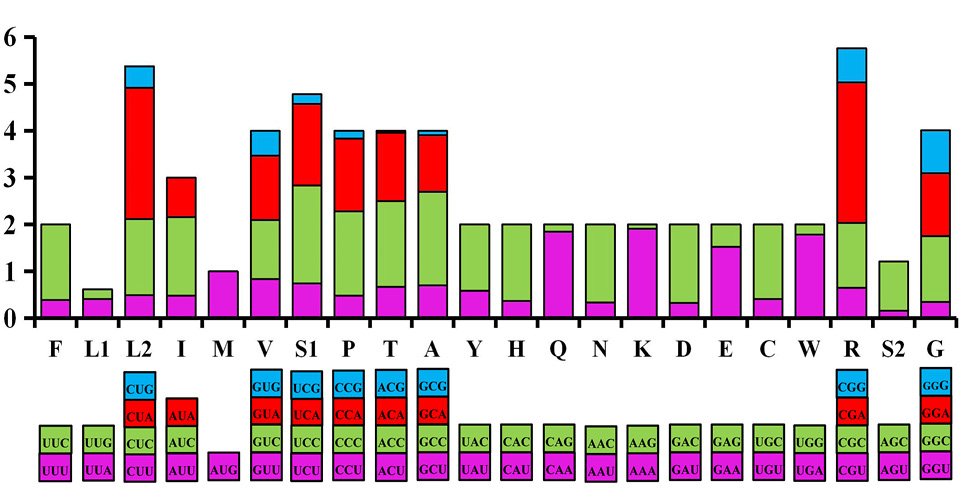
Percentages of amino acid usage in mitochondrial genomes of T. merula. A. Codon distribution in T. merula mitogenome. Codon families were provided on the X axis. Each amino acid is represented by the one-letter abbreviation. Note that leucine and serine are each coded by two different genetic codons, and listed separately.

Relative Synonymous Codon Usage (RSCU) in T. merula mitogenome. Codon families were provided on the X axis and the RSCU values on the Y axis.
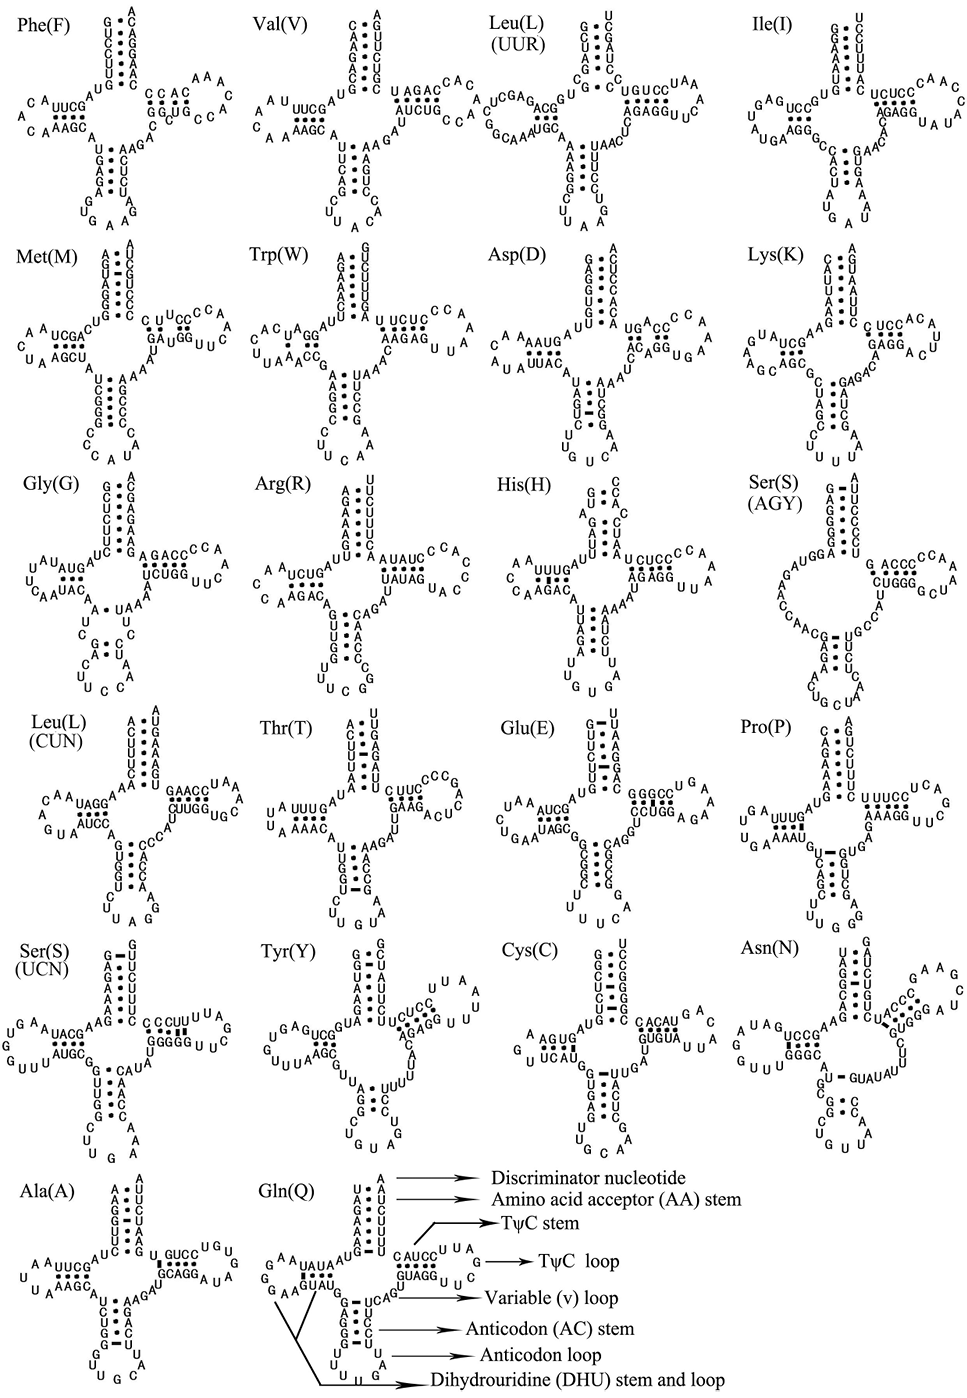
Predicted secondary structures for the 22 tRNA genes of T. merula.
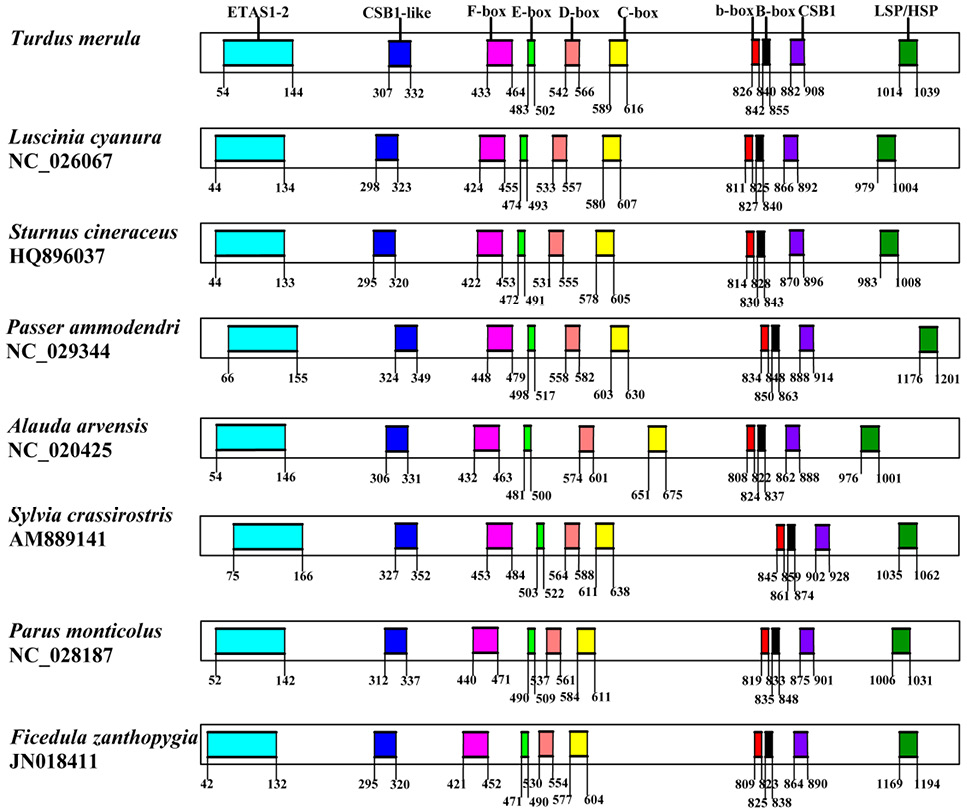
The structure of the control region of T. merula in this study. The number in rectangle frames denotes the numerical value of the boundary. Sequential features are indicated above the graph.

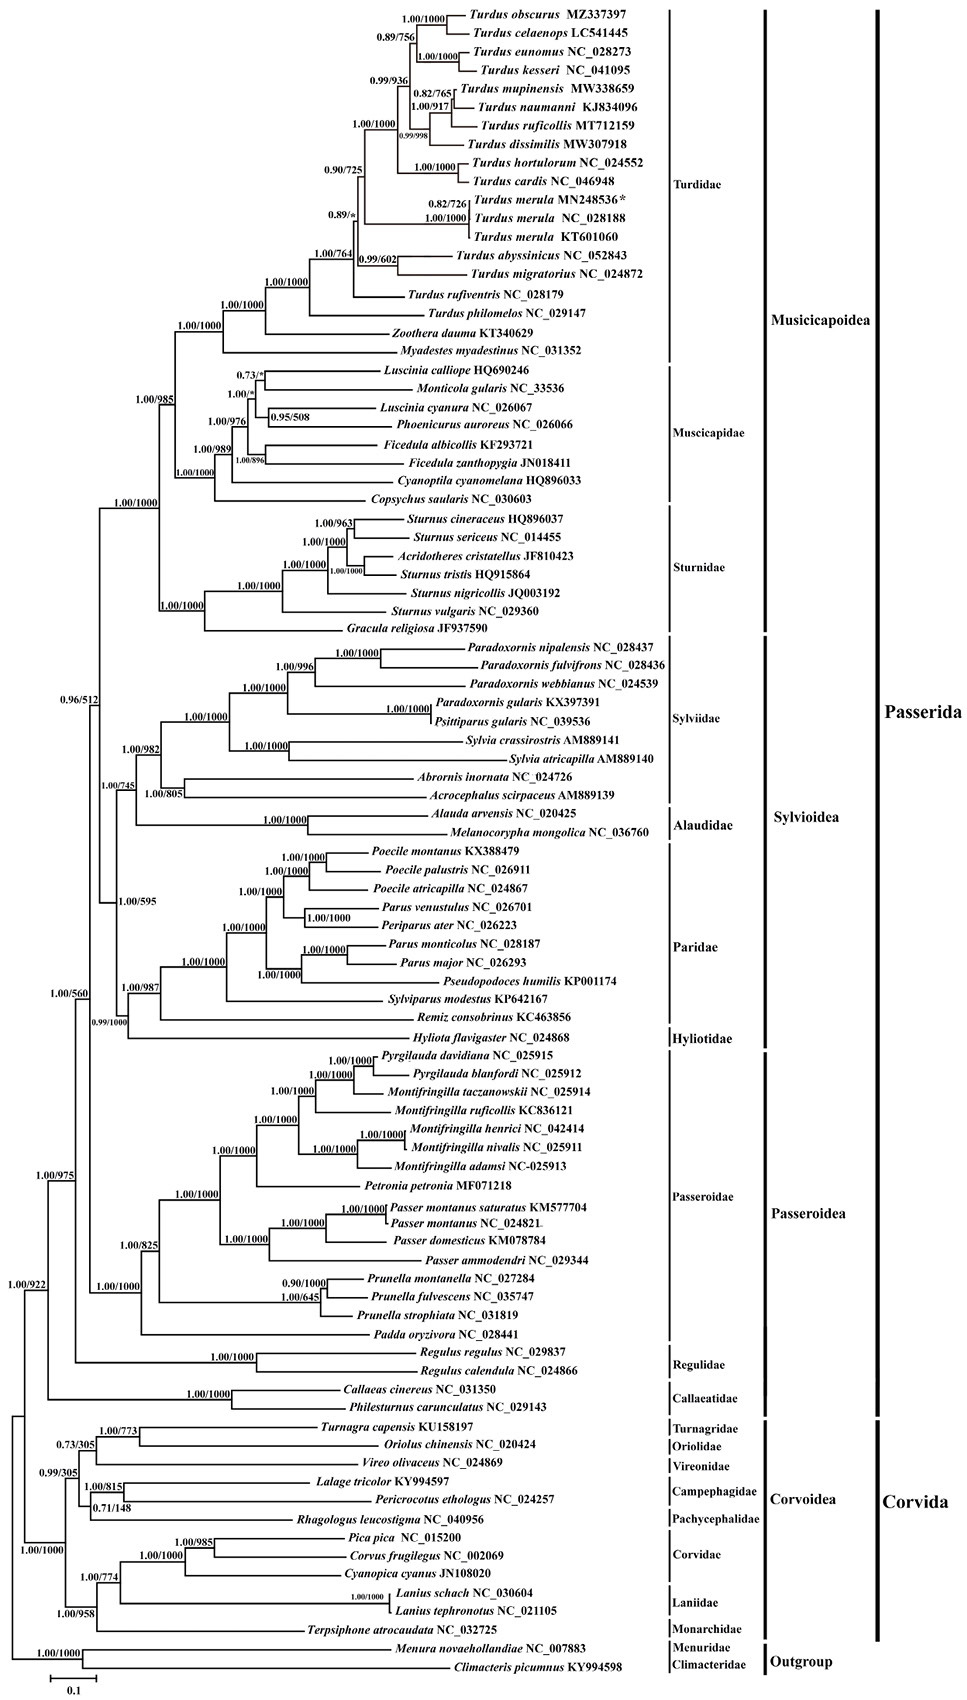
Inferred phylogenetic relationships based on 13 protein-coding genes with Bayesian inference (BI) and maximum likelihood (ML), respectively. Menura novaehollandiae (NC_007883) and Climacteris picumnus (KY994598) were used as outgroups. Bayesian posterior probability (BPP) and Bootstrap value (BP) of each node are shown in turn, such as BPP/BP 1.00/1000. The asterisk indicates that the BP value is less than 500. Sequences were analysed under the GTR+I+G model, based on the AIC criterion.

