

Immunomodulatory Effect of Bacillus licheniformis Again st the Aflatoxins Induced Molecular Pathological Changes in Rat Model


Immunomodulatory Effect of Bacillus licheniformis Again st the Aflatoxins Induced Molecular Pathological Changes in Rat Model
Samia S. Alkhalil1, Faisal Al-Sarraj2, Abeer S. Aloufi3, Zuhair M. Mohammedsaleh4, Mamdoh S. Moawadh4, Fayez M. Saleh5, Majid Al-Zahrani6, Waheeb Aggad7, Youssef S. Alghamdi8, Mutaib M. Mashraqi9, Saleh Alshamrani9 and
Mona H. Soliman10,11*
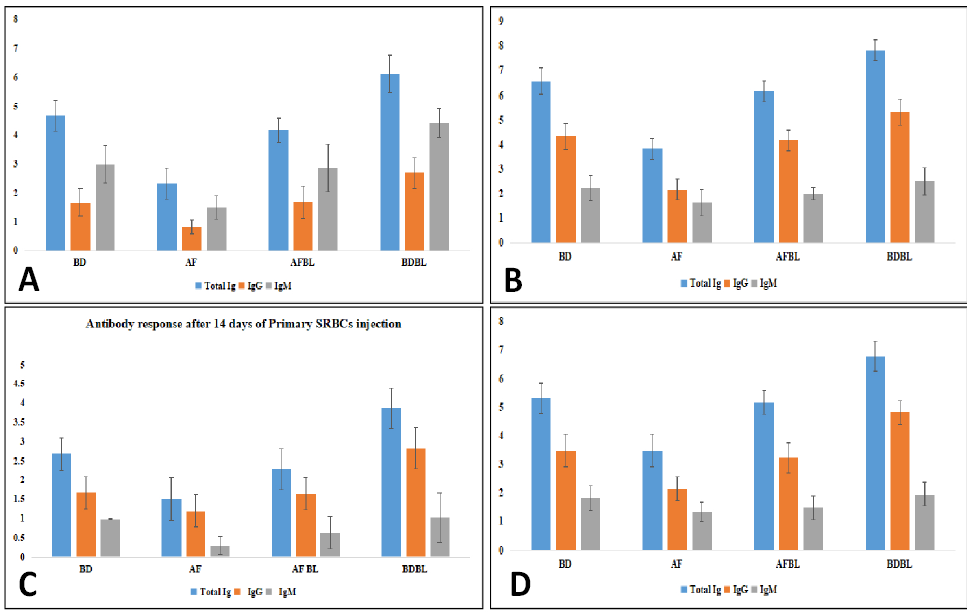
Antibody response after 7 days of (A) Primary, (B) secondary SRBCs injection and after 14 days, (C) primary, (D) secondary SRBCs injection.
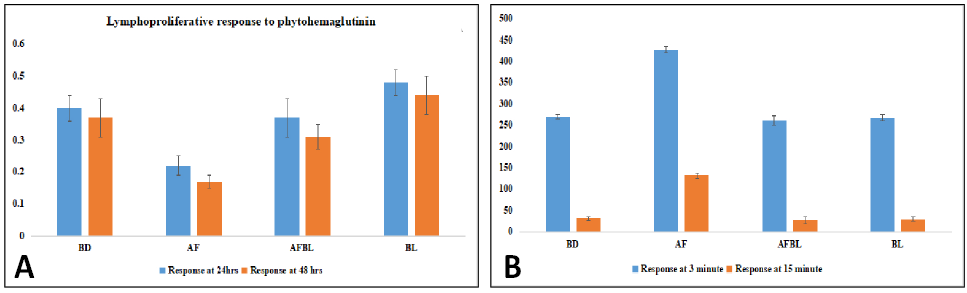
(A) Lymphoproliferative response to phytohemagglutinin of rats treated with aflatoxins and Bacillus licheniformis in different combinations and (B) Phagocytic index of rats treated with aflatoxins and Bacillus licheniformis in different combinations.

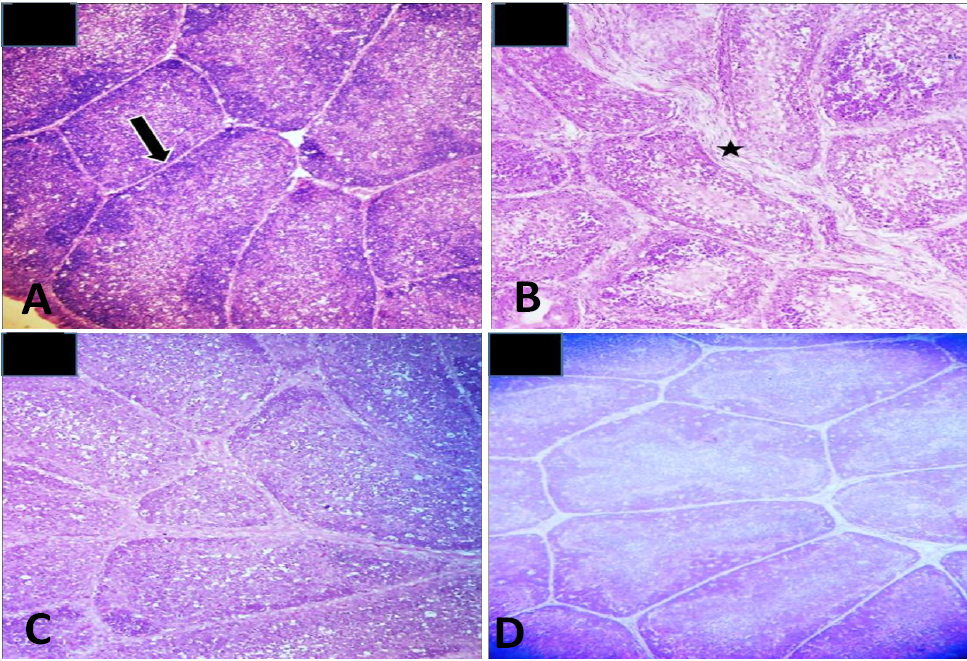
Histopathological examination of bursa of Fabricius of rats treated with aflatoxins and Bacillus licheniformis in different combinations. (A) Photomicrograph of group A (Basal diet) showing normal parenchyma of bursa of Fabricius. (B) Photomicrograph of group B (aflatoxins) showing increased interfollicular spaces. (C) Photomicrograph of group C (aflatoxins and Bacillus) showing almost normal parenchyma (D) Photomicrograph of group D (Bacillus) showing normal bursal parenchyma.

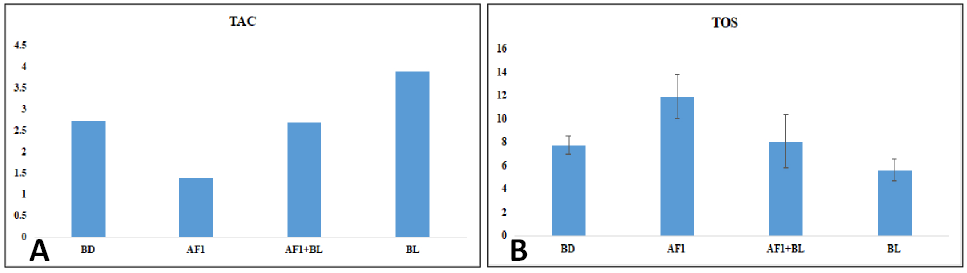
(A) Total antioxidants concentration (TAC) in the serum of rats treated with aflatoxins and Bacillus licheniformis in different combinations and (B) Total antioxidants status (TOS) in the serum of rats treated with aflatoxins and Bacillus licheniformis in different combinations.

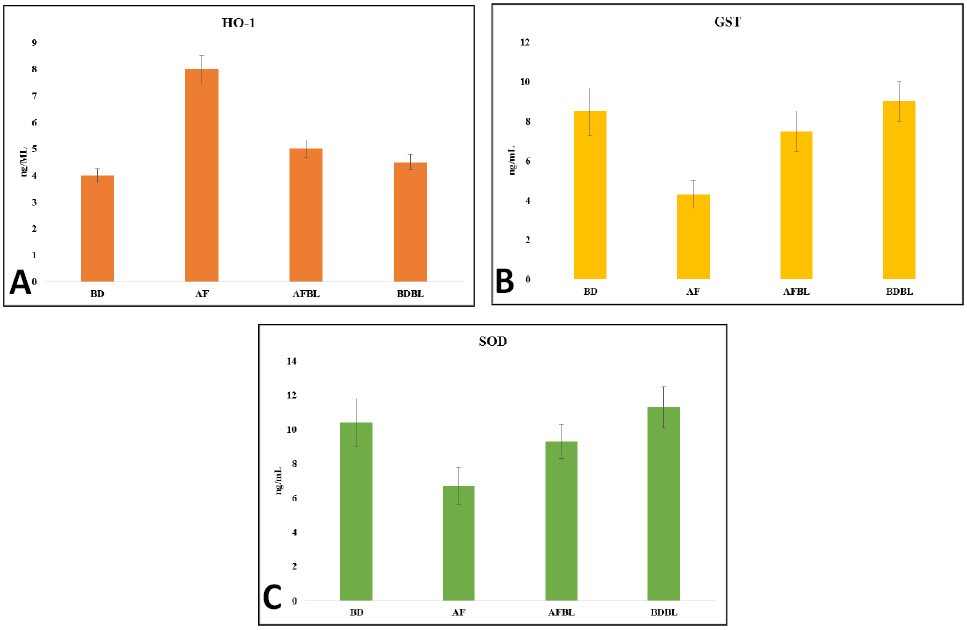
(A) Serum concentrations of heme oxygenease 1 (HO-1), (B) glutathione S transferase (GST), and (C) superoxide dismutase (SOD) of rats treated with aflatoxins and Bacillus licheniformis in different combinations
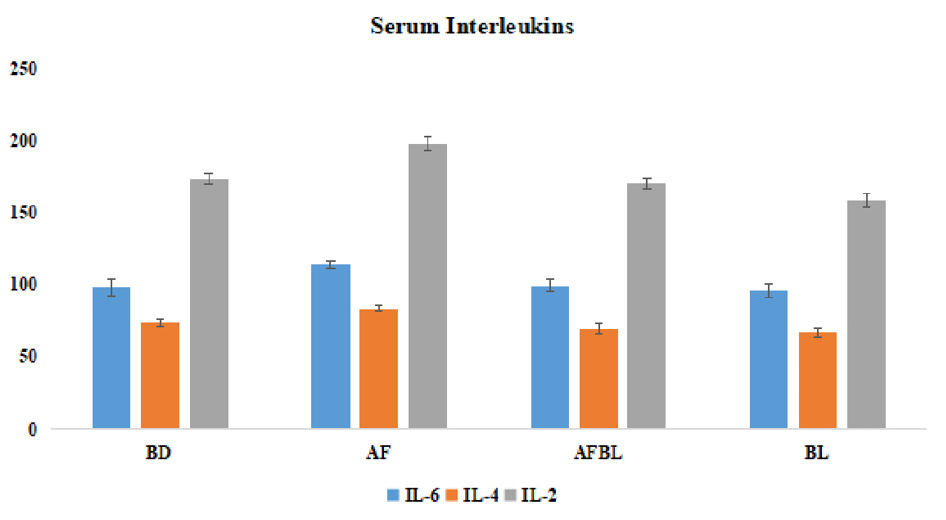
Serum interleukin concentrations of rats treated with aflatoxins and Bacillus licheniformis in different combinations.
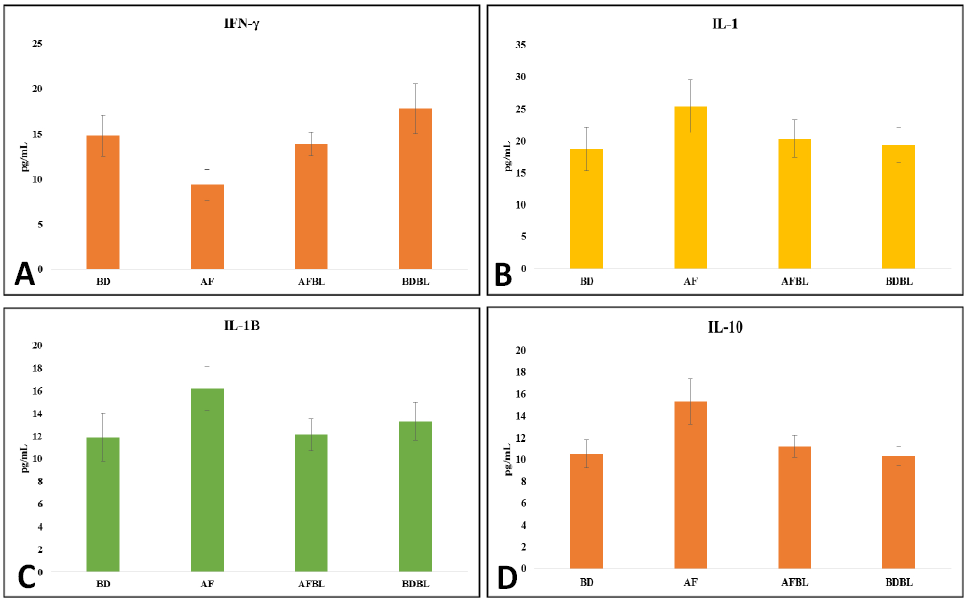
IFN-γ (A), IL-1 (B), IL-1B (C), and IL-10 (D) concentrations in the serum of rats treated with aflatoxins and Bacillus licheniformis in different combinations.

