

Tupaia belangeri (Wagner, 1841), a Northern Treeshrew is an Animal Model of Metabolic Healthy Obesity


Tupaia belangeri (Wagner, 1841), a Northern Treeshrew is an Animal Model of Metabolic Healthy Obesity
Yanfei Cai1, Jiahong Feng1 and Wanlong Zhu1,2,3*
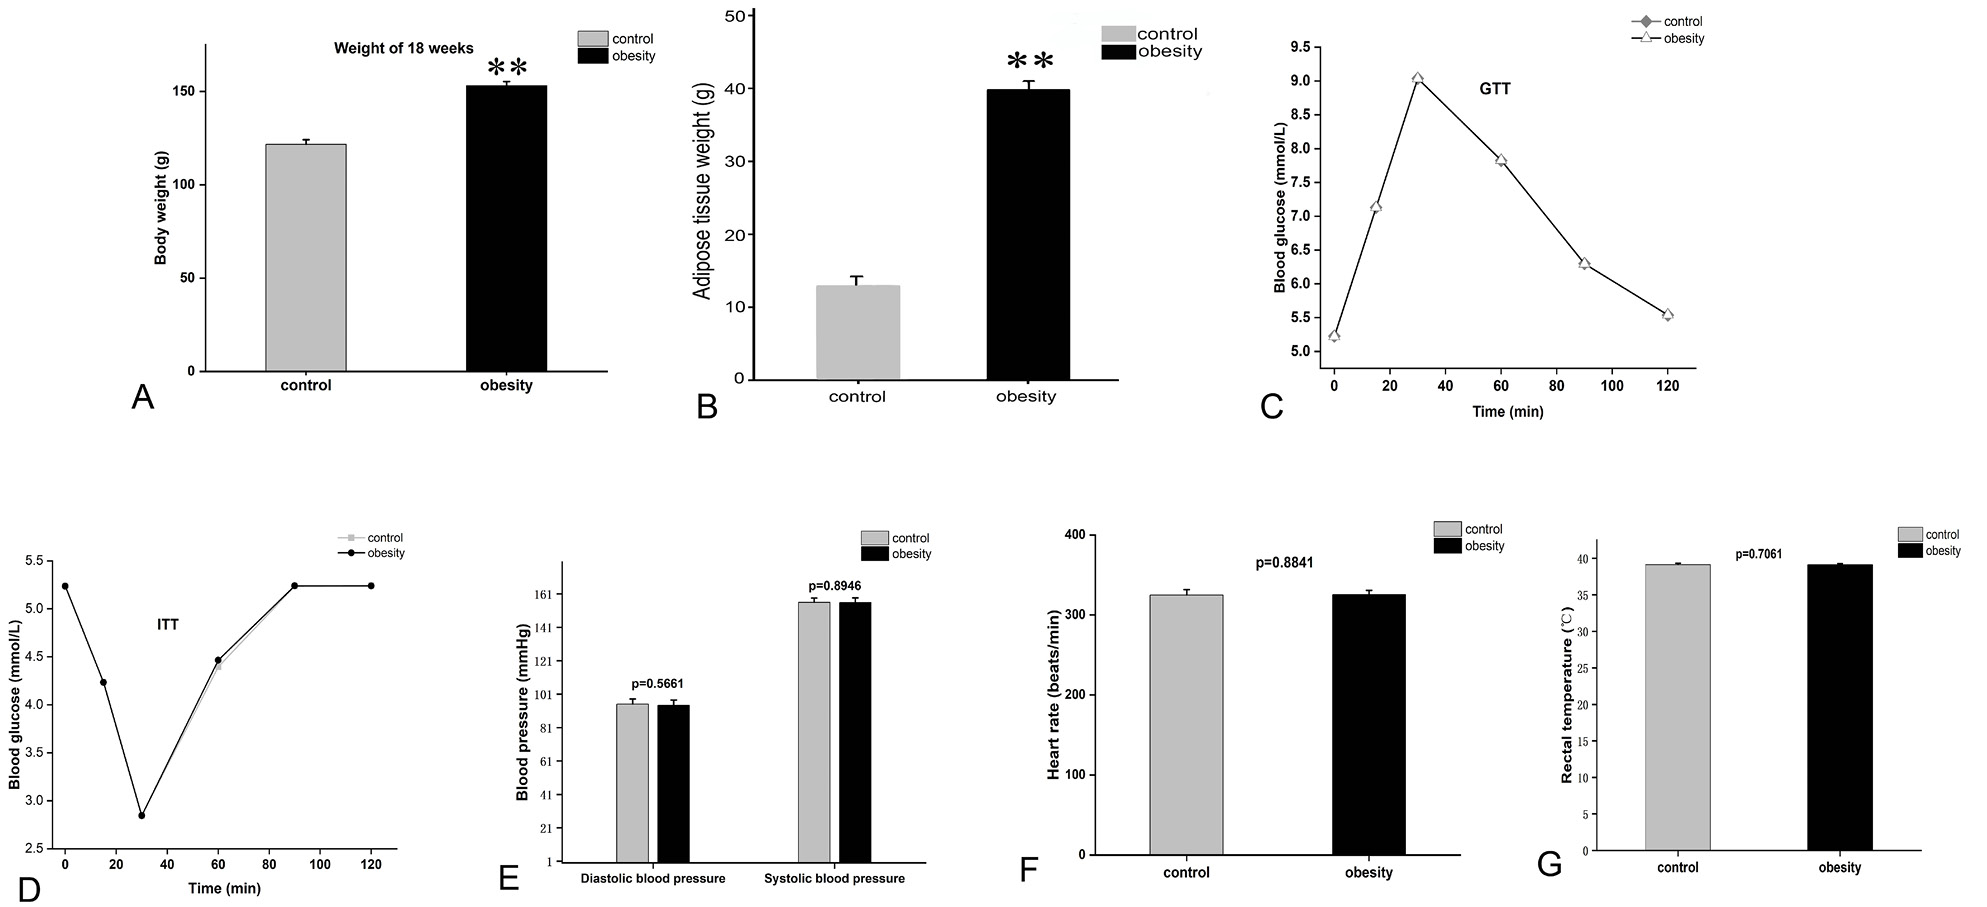
A, Body weight (BW) of control and obesity group T. belangeri in 18th week. B, Adipose tissue weight of control and obesity group T. belangeri in 18th week. C, Glycemic response during GTT. D, Glycemic response during ITT. E, Blood pressure of control and obesity group T. belangeri. F, Heart rate of control and obesity group T. belangeri. G, Rectal temperature of control and obesity group T. belangeri; N= 14 per group; statistical significance is indicated: *P < 0.05, **P < 0.01.
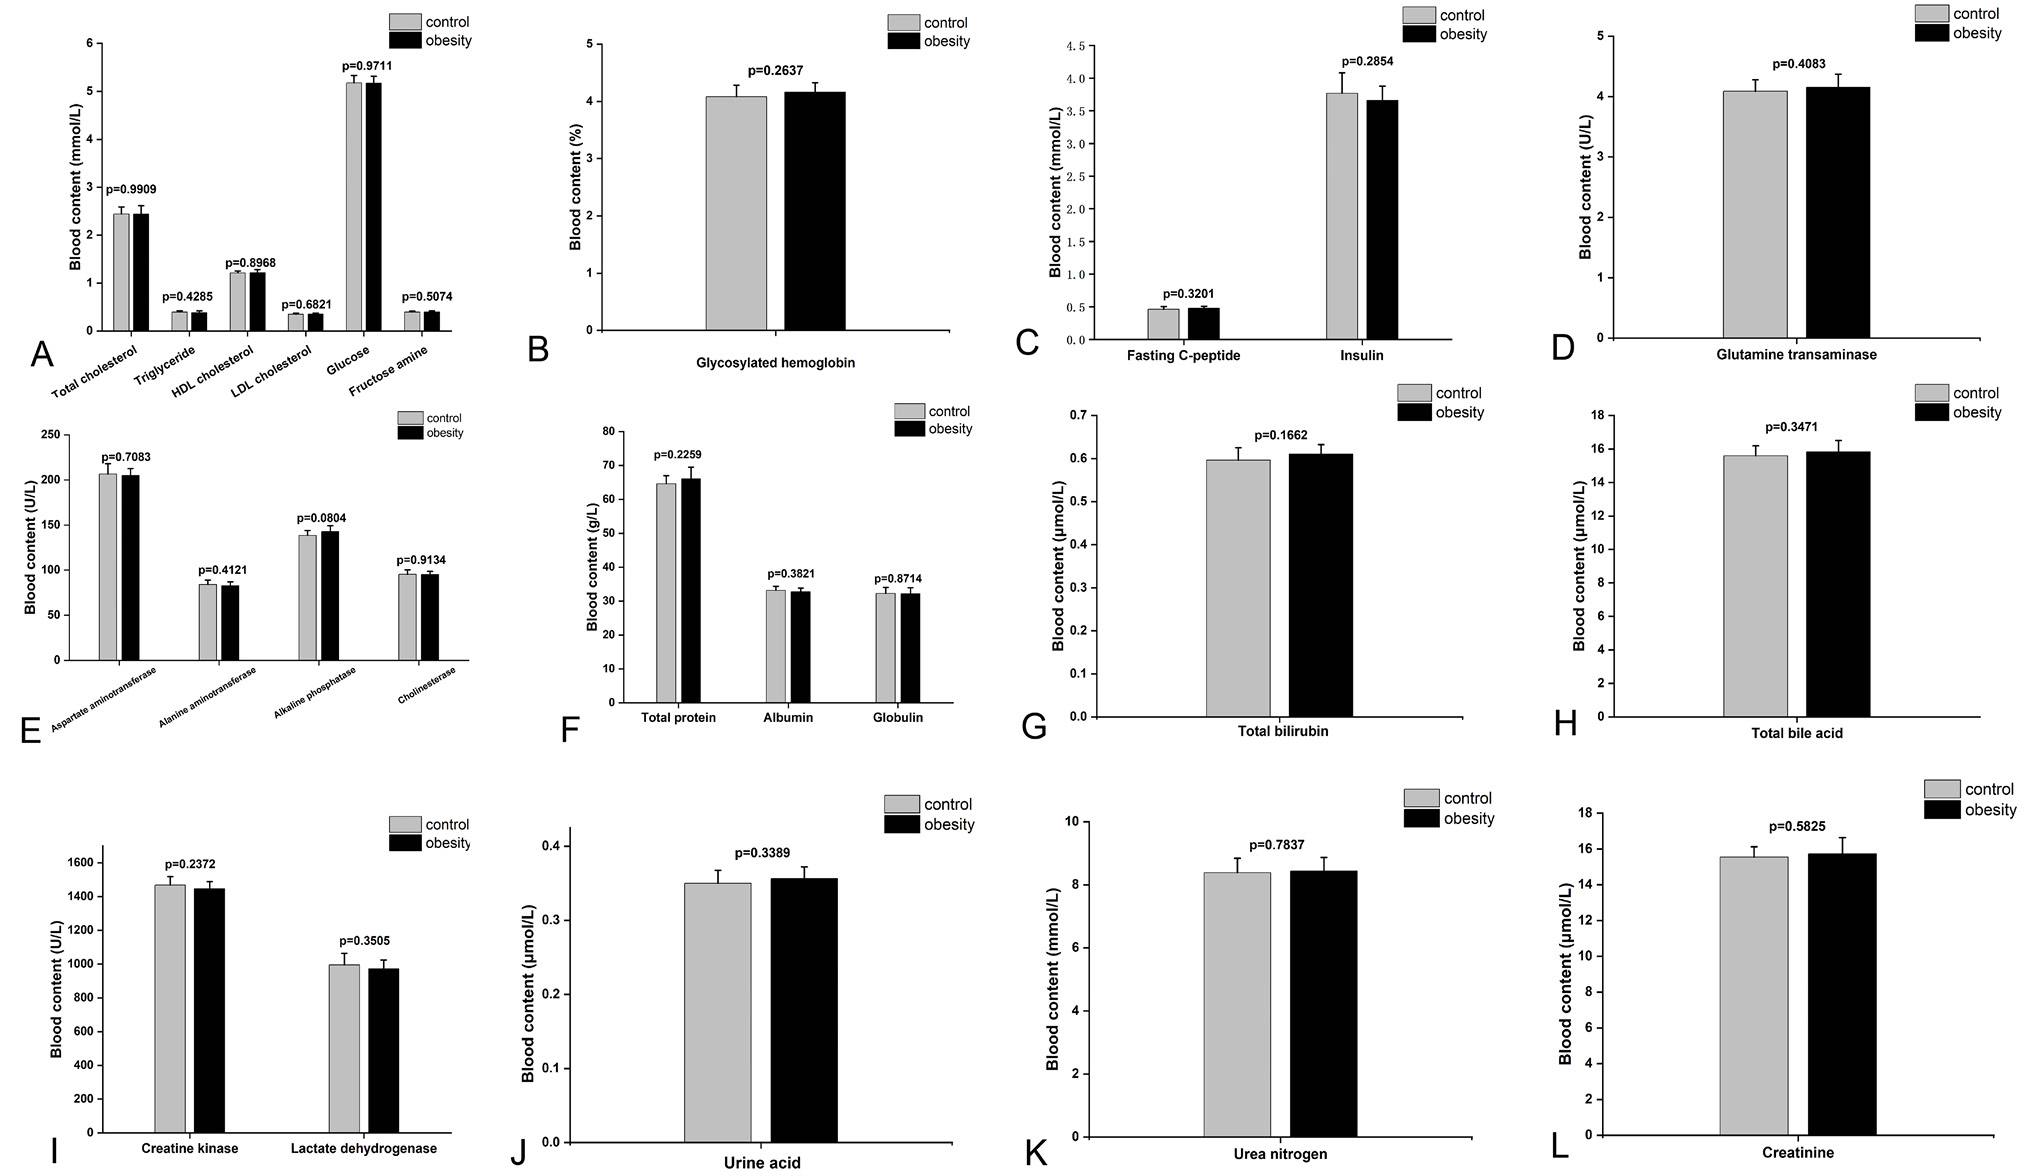
A, Total cholesterol, triglyceride, high density lipoprotein cholesterol, low density lipoprotein cholesterol, glucose, fructose amine levels in blood. B, Glycosylated hemoglobin levels in blood. C, Fasting c-peptide, insulin levels in blood. D, Glutamine transaminase levels in blood. E, Aspartate aminotransferase, alanine aminotransferase, alkaline phosphatase, cholinesterase levels in blood. F, Total protein, albumin, globulin levels in blood. G, Total bilirubin levels in blood. H, Total bile acid levels in blood. I, Creatine kinase, lactate dehydrogenase levels in blood. J, Urine acid levels in blood. K, Urea nitrogen levels in blood. L, Creatinine levels in blood. Data are presented as mean ± SEM; N= 14 per group; statistical significance is indicated: *P < 0.05, ** P < 0.01.
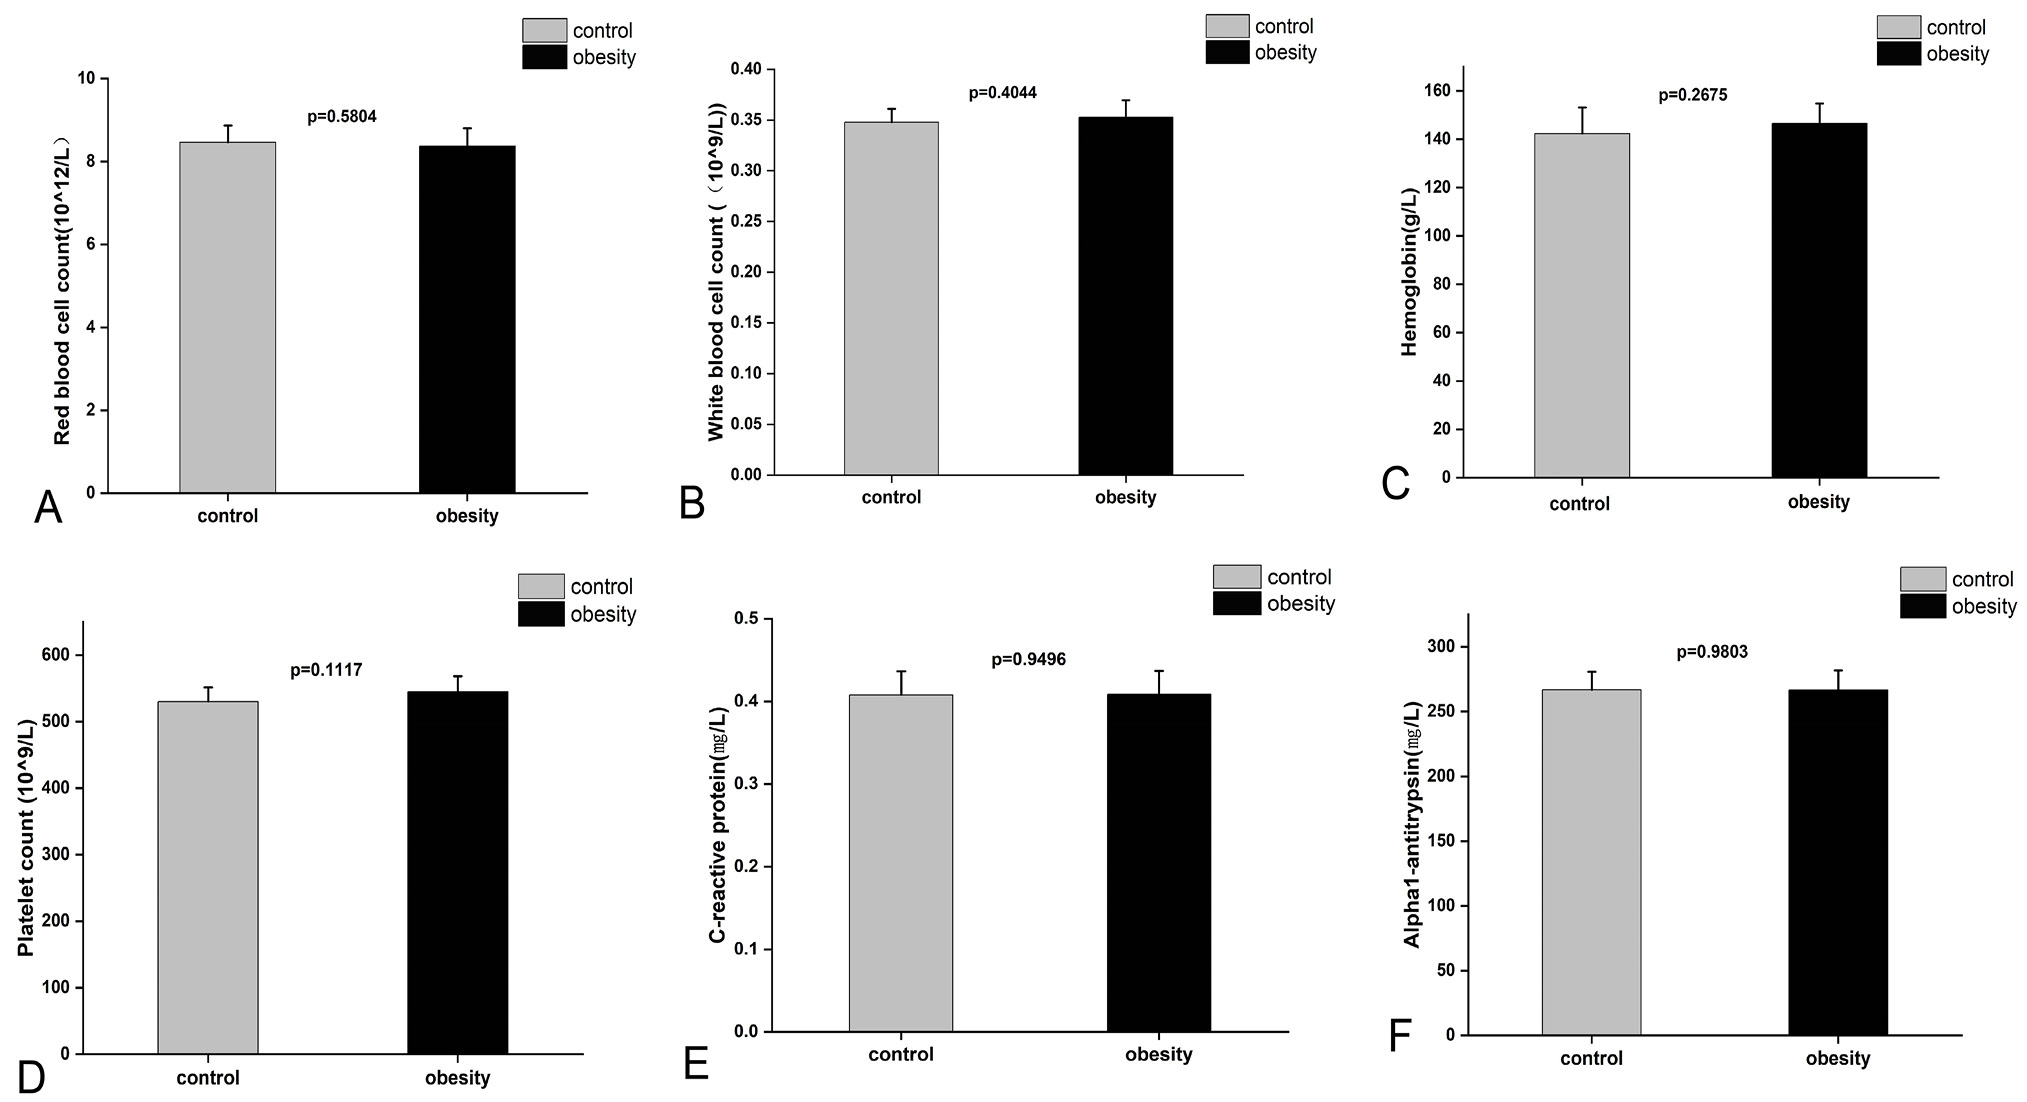
A, Red blood cell count levels in blood. B, White blood cell count levels in blood. C, Hemoglobin levels in blood. D, Platelet levels in blood. E, C-reactive protein concentration levels in blood. F, Alpha1-antitrypsin concentration levels in blood. Data are presented as mean ± SEM; N= 14 per group; statistical significance is indicated: *P < 0.05, ** P < 0.01.
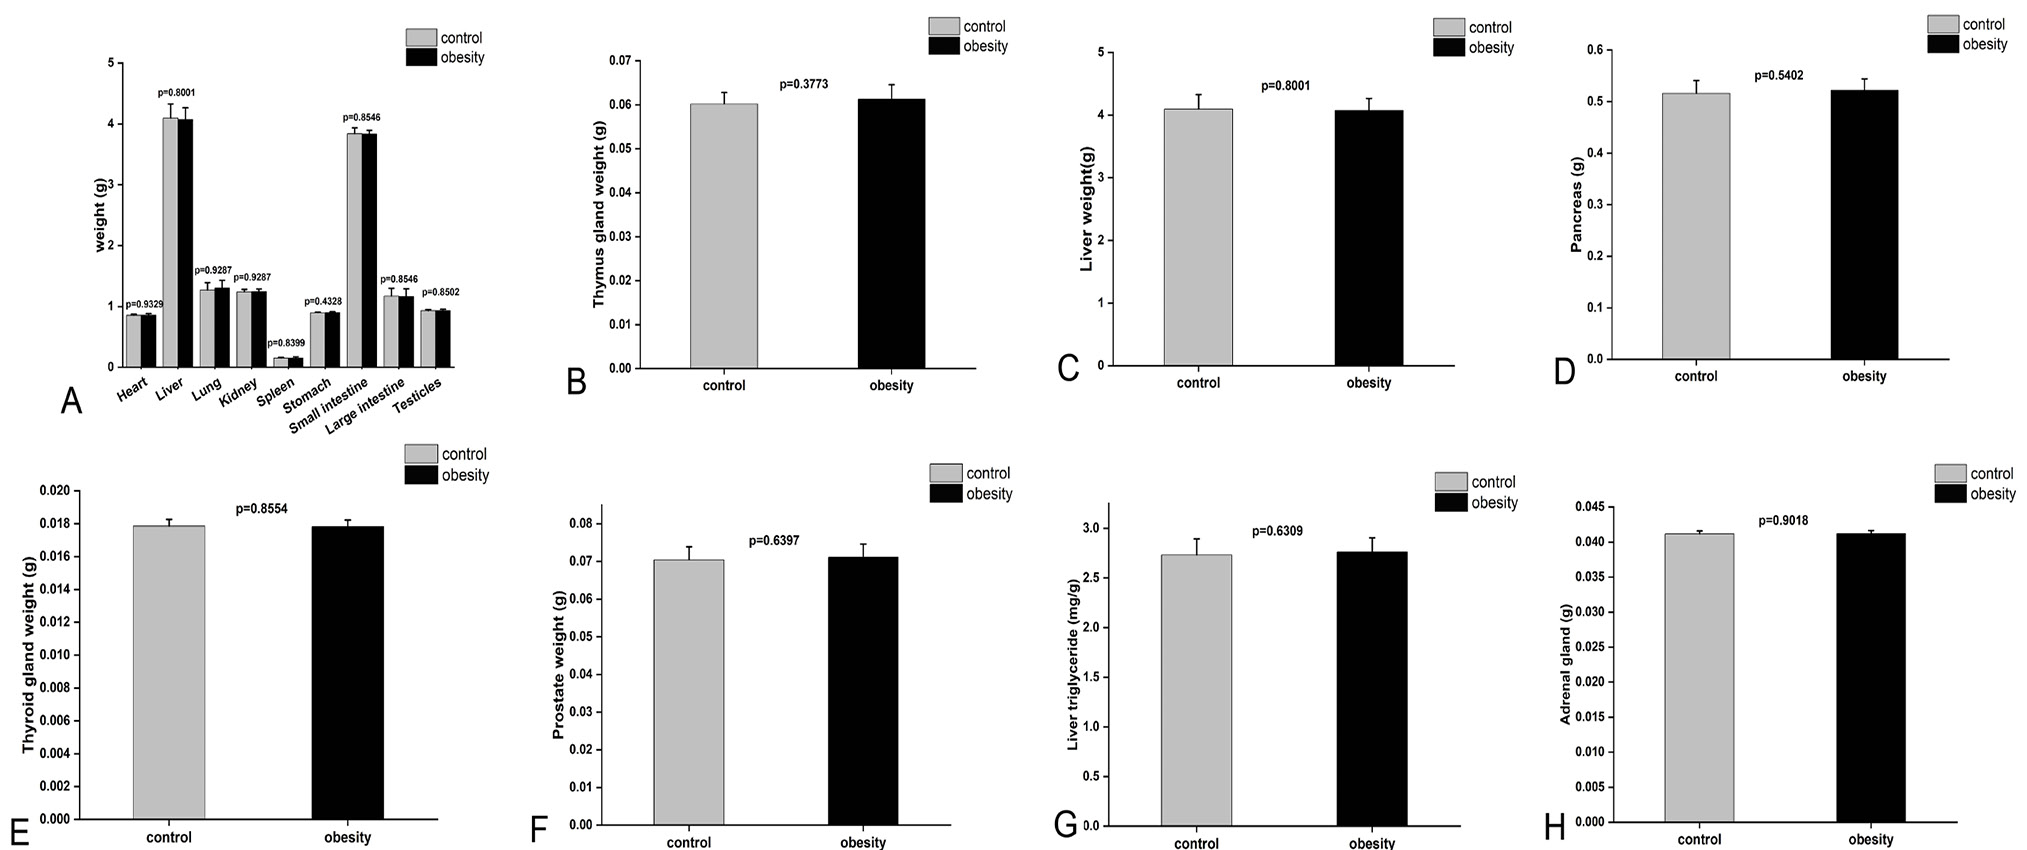
A, Weight of heart, liver, lung, kidney, spleen, stomach, small intestine, large intestine, testis in control and obesity group. B, Weight of thymus gland in control and obesity group. C, Liver weight of control and obesity group T. belangeri, Vertical axis shows mass in grams for BW. D, Weight of pancreas in control and obesity group. E, Weight of thyroid gland in control and obesity group. F, Weight of prostate in control and obesity group. G, Liver triglyceride content in control and obesity group T. belangeri. H, Weight of adrenal gland in control and obesity group. Data are presented as mean ± SEM; N= 14 per group except H; statistical significance is indicated: *P < 0.05, **P < 0.01.

