
Ameliorative Role of Ethanolic Extract of Fagonia cretica on BPA-Induced Genetic Alterations and Histological Changes in Liver and Kidney Tissues of Rats


Ameliorative Role of Ethanolic Extract of Fagonia cretica on BPA-Induced Genetic Alterations and Histological Changes in Liver and Kidney Tissues of Rats
Dalia M. Aboelhassan1*, Inas S. Ghaly1, Noha E. Ibrahim2, Nermeen M. Shaffie3, Mariam G. Eshak1, Aboelfetoh M. Abdallah4, Ibrahim M. Farag1
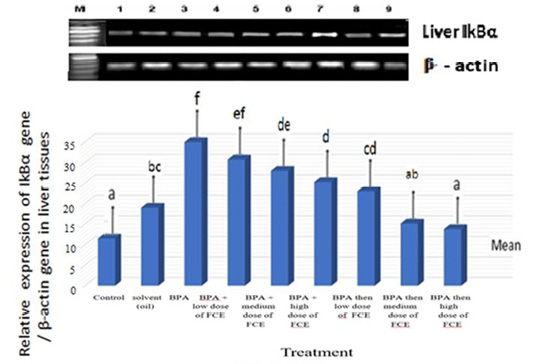
Gene expression levels of IkBα gene in liver tissues of male rats that had been treated with FCE against BPA. These expression levels had been assayed by semi-quantitative RT-PCR. Recovery rate of mRNA was estimated as the ratio between the intensity of IkBα gene and the β-actin gene. The means with different letters are significantly different (P<0.05). M=DNA ladder. Lane 1=normal control. Lane 2=solvent (oil). Lane 3=BPA. Lane 4=BPA+low dose of FCE. Lane 5=BPA+medium dose of FCE. Lane 6=BPA+high dose of FCE. Lane 7=BPA then low dose of FCE. Lane 8=BPA then medium dose of FCE. Lane 9=BPA then high dose of FCE.

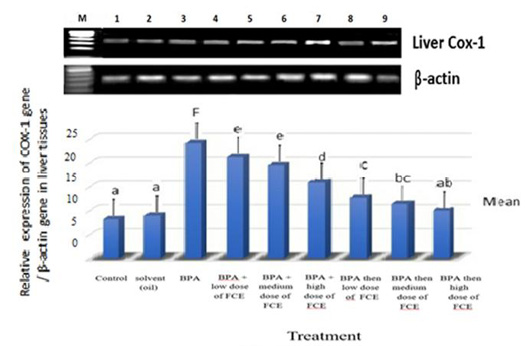
Gene expression levels of COX-1 gene in liver tissues of male rats that had been treated with FCE against BPA. These expression levels had been assayed by semi-quantitative RT-PCR. Recovery rate of mRNA was estimated as the ratio between the intensity of COX-1 gene and the β-actin gene. The means with different letters are significantly different (P<0.05). M=DNA ladder. Lane 1=normal control. Lane 2=solvent (oil). Lane 3=BPA. Lane 4=BPA+low dose of FCE. Lane 5=BPA+medium dose of FCE. Lane 6=BPA+high dose of FCE. Lane 7=BPA then low dose of FCE. Lane 8=BPA then medium dose of FCE. Lane 9=BPA then high dose of FCE.
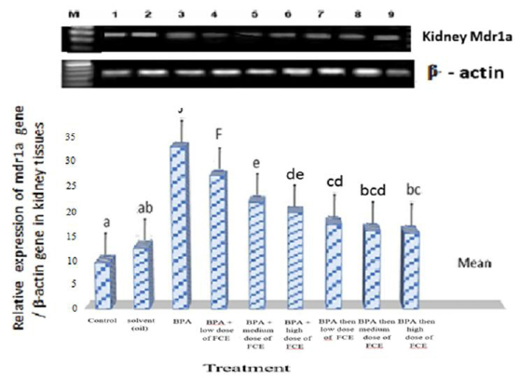
Gene expression levels of Mdr1a gene in kidney tissues of male rats that had been treated with FCE against BPA. These expression levels had been assayed by semi-quantitative RT-PCR. Recovery rate of mRNA was estimated as the ratio between the intensity of Mdr1a gene and the β-actin gene. The means with different letters are significantly different (P<0.05). M=DNA ladder. Lane 1=normal control. Lane 2=solvent (oil). Lane 3=BPA. Lane 4=BPA+low dose of FCE. Lane 5=BPA+medium dose of FCE. Lane 6=BPA+high dose of FCE. Lane 7=BPA then low dose of FCE. Lane 8=BPA then medium dose of FCE. Lane 9=BPA then high dose of FCE.

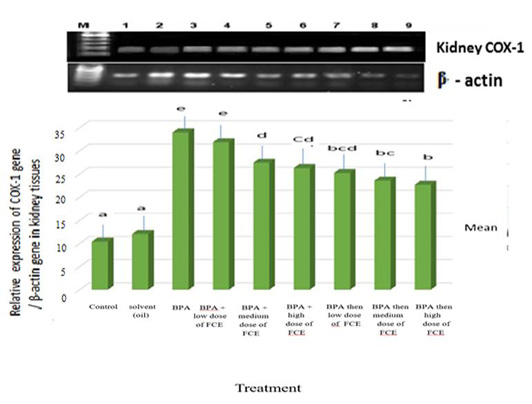
Gene expression levels of COX-1 gene in kidney tissues of male rats that had been treated with FCE against BPA assayed by semi-quantitative RT-PCR. Recovery rate of mRNA was estimated as the ratio between the intensity of COX-1 gene and the β-actin gene. The means with different letters are significantly different (P<0.05). M=DNA ladder. Lane 1=normal control. Lane2=solvent (oil). Lane 3=BPA. Lane 4=BPA+low dose of FCE. Lane 5=BPA+medium dose of FCE. Lane 6=BPA+ high dose of FCE. Lane 7=BPA then low dose of FCE. Lane 8=BPA then medium dose of FCE. Lane 9=BPA then high dose of FCE.
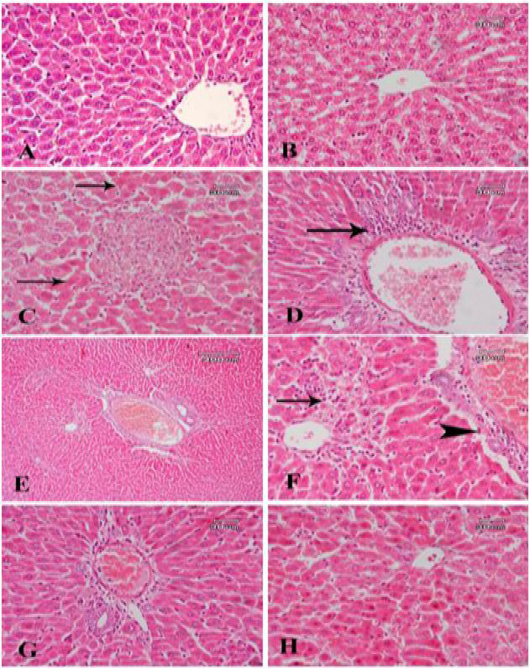
A photomicrograph of sections from liver tissue: (A) of control -ve group shows the normal structure of the hepatic lobule. (B) of a rat treated with corn oil shows a quite normal structure of liver tissue. (C) from a rat treated with bisphenol shows an area of necrotic cells with acidophilic hepatic cells (arrow) in the area around. (D) Another section for the same group shows dilatation of central vein with fibrosis and cellular infiltration around (arrow). (E) From a rat treated with bisphenol and Fagonia cretica (low dose) shows dilatation of central vein with fibrosis around is still noticed. (F) A higher magnification for a part of the previous section shows a slight reduction of fibrous tissue around vein (arrowhead) and dilated blood sinusoids with cellular infiltration (arrow). (G) A section from a rat treated with bisphenol and Fagonia cretica (medium dose) shows marked reduction of fibrous tissue and cellular infiltration around main blood vessels. (H) A section from a rat treated with bisphenol and Fagonia cretica (high dose) shows no fibrous tissue or cellular infiltration, but some acidophilic hepatic cells are still observed.
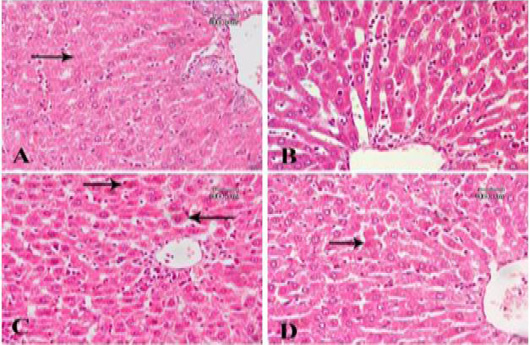
A photomicrograph of sections from liver tissue: (A) section of rat treated with bisphenol and then Fagonia cretica (low dose) shows mild fibrosis around main blood vessels. Some hepatocytes show karryolysis (arrow). (B) Another section for the same group shows mild dilatation and congestion of blood sinusoids. (C) A section of rat treated with bisphenol and then Fagonia cretica (medium dose) shows slight cellular infiltration. Some hepatocytes show acidophilic color (arrow). (D) A section of rat treated with bisphenol and then Fagonia cretica (high dose) shows marked amelioration of liver tissue, only a few acidophilic hepatocytes are observed (arrow).
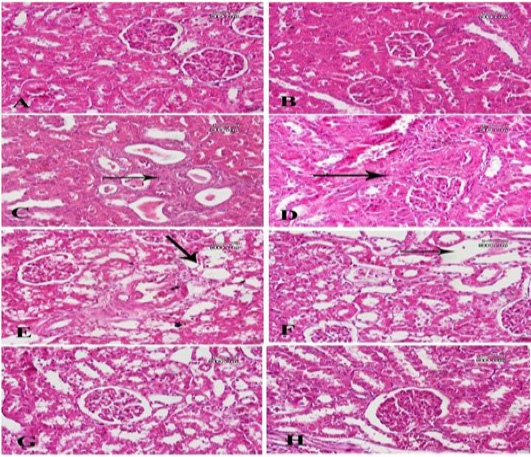
A photomicrograph of sections from renal tissue: (A) From a control -ve group shows the normal structure of the renal glomeruli and the different types of tubules. (B) from a rat treated with corn oil shows no abnormal structure in renal tissue. (C) from a rat treated with bisphenol shows many dilated tubules with necrotic materials within their lumens and increased connective tissue component around them (arrow). (D) Another section for the same group shows massive distortion of renal tissue due to marked increase of connective tissue components (arrow). (F) From a rat treated with bisphenol and Fagonia cretica (low dose) shows slight decrease of fibrosis, but dilated tubules are still noticed (arrow). (F) Another section of the same group shows marked reduction of fibrous, but many tubules show marked dilatation of their lumens with atrophy of lining epithelium (arrow). (G) A section from a rat treated with bisphenol and Fagonia cretica (medium dose) shows many tubules are still dilated with atrophied epithelial lining and no fibrosis around. (H) A section from a rat treated with bisphenol and Fagonia cretica (high dose) shows marked reduction of dilated tubules with no fibrosis.
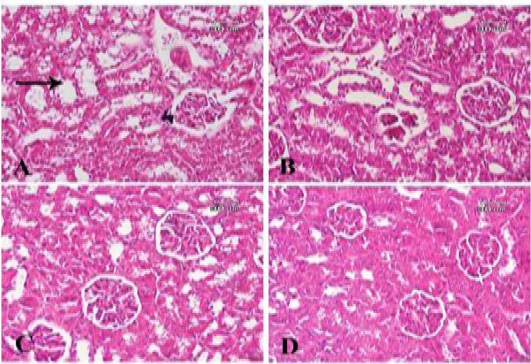
A photomicrograph of sections from renal tissue: (A) A section of rat treated with bisphenol and then Fagonia cretica (low dose) shows mild dilatation of renal tubules (arrow). (B) Another section for the same group shows the same results. (C) A section of rat treated with bisphenol and then Fagonia cretica (medium dose) shows slight dilatation of some tubules with no fibrosis. (D) A section of rat treated with bisphenol and then Fagonia cretica (high dose) shows renal tissue close to normal.
