
Antibacterial Effect of Co-Administration of Diclofenac and Ciprofloxacin against Infection Induced by Resistance E coli (O157-H7) in Female Rabbits


Antibacterial Effect of Co-Administration of Diclofenac and Ciprofloxacin against Infection Induced by Resistance E coli (O157-H7) in Female Rabbits
Frah Razzaq Kbyeh1, Ahmed N. Abedsalih2*
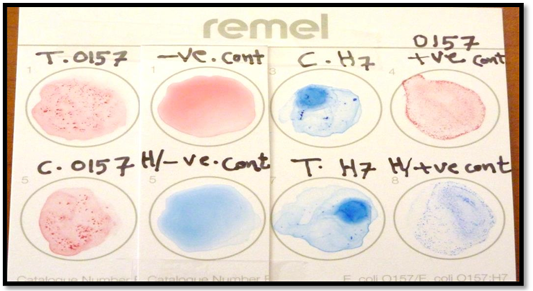
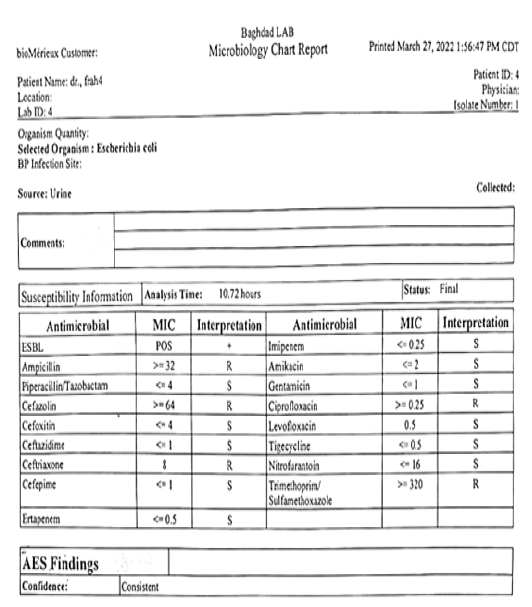
Serotyping of isolates by Wella colex color resistance E. coli O157:H7test.

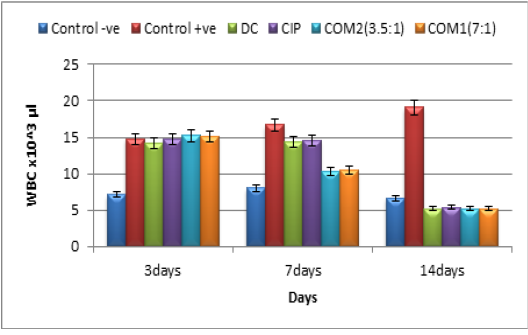
White blood cell counting x 103/ul in infected groups by resistance E coli 0157 H7 treated by ciprofloxacin ,diclofenac alone and combination between (ciprofloxacin +diclofenac) in two doses(mg/kg) and control groups
DC=diclofenac dosage 1mg/kg
CIP=ciprofloxacin dosage 7 mg/kg
COM1= (ciprofloxacin3.5mg/kg +diclofenac1mg/kg)
COM2= (ciprofloxacin1.75mg/kg +diclofenac1mg/kg)

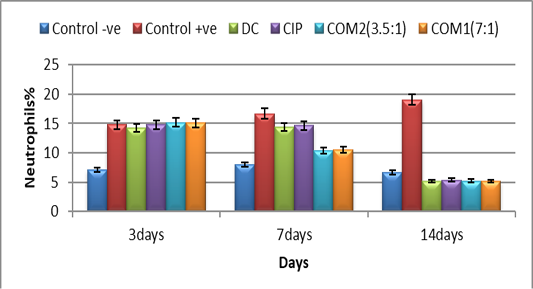
Neutrophils% in infected groups by resist. E coli 0157 :H7 treated by ciprofloxacin, diclofenac alone, and a combination between (ciprofloxacin +diclofenac) in two doses(mg/kg) and control groups
DC=diclofenac dosage 1mg/kg
CIP=ciprofloxacin dosage 7 mg/kg
COM1= (ciprofloxacin3.5mg/kg +diclofenac1mg/kg)
COM2= (ciprofloxacin1.75mg/kg +diclofenac1mg/kg)
capital letters are used to compare the rows.

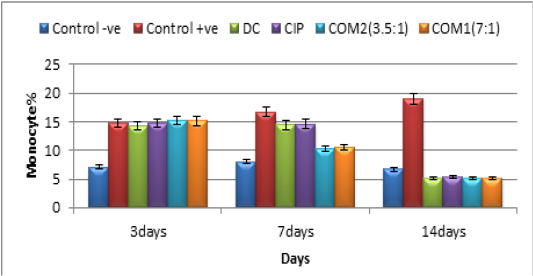
Monocyte % in infected groups by resistance E coli 0157: H7 treated by ciprofloxacin, diclofenac alone, and a combination between (ciprofloxacin +diclofenac) in two doses(mg/kg) and control groups
DC=diclofenac dosage 1mg/kg
CIP=ciprofloxacin dosage 7 mg/kg
COM1= (ciprofloxacin3.5mg/kg +diclofenac1mg/kg)
COM2=(ciprofloxacin1.75mg/kg +diclofenac1mg/kg)
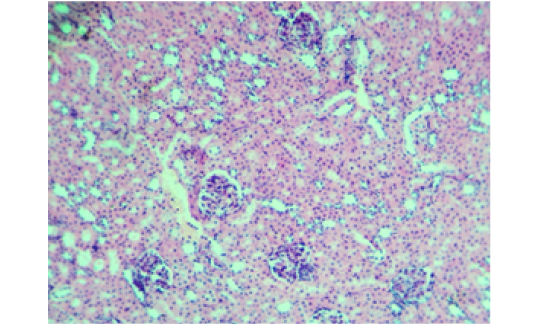
Histological section in the kidney from negative control shows: normal renal cortex from glomeruli and renal tubules. (H&E stain, 100X).
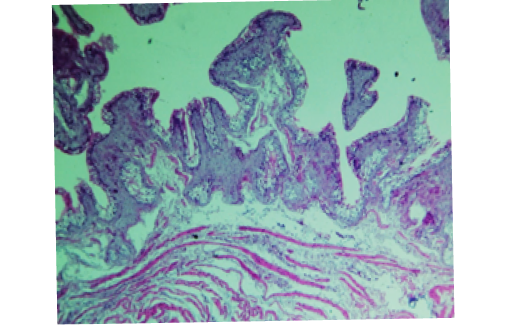
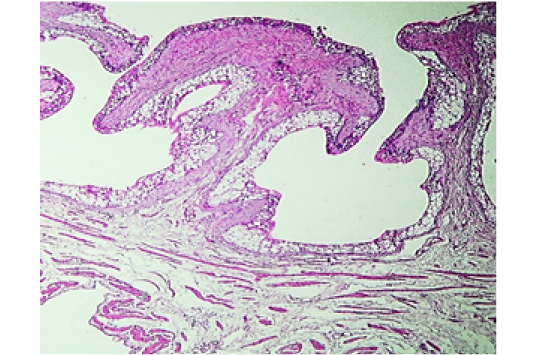
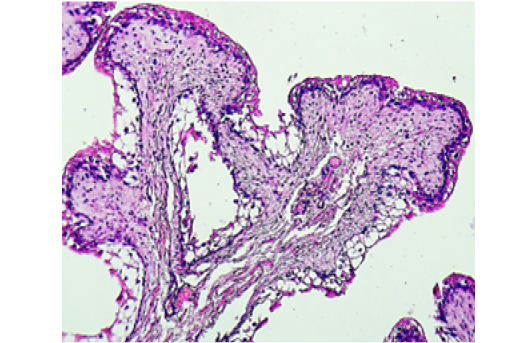
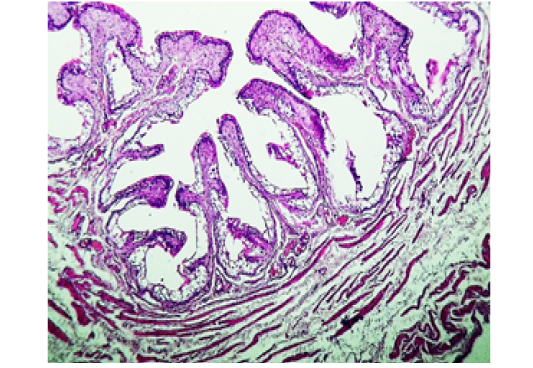
Histological section in the urinary bladder from negative control shows: normal transitional mucosal epithelium, submucosa, and muscle coat. (H&E stain, 100X).
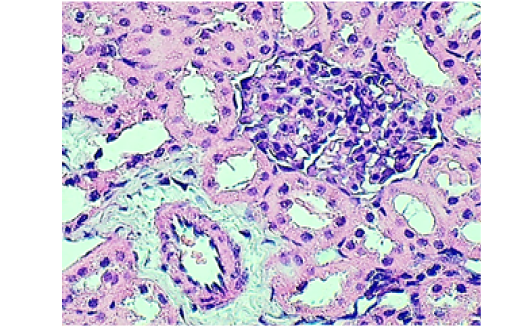
Histopathological show for renal from ciprofloxacin group female rabbit (CIP) shows: enlarged-congested glomerulus glomerular hypercellularity and perivascular edema . (H&E stain, 400X).

Histopathological show for urinary bladder from positive control (P.C.) female rabbit shows: vacuolar degeneration of transitional epithelium and eosinophilia (arrow). (H&E stain, 200X).
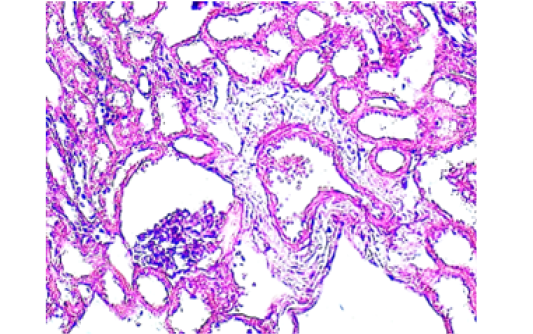
Histopathological show for renal from diclofenac group(D.C.) female rabbit shows: atrophic glomerular tuft, distended Bowman’s space containing slight edema. interstitial perivascular edema and segmental necrosis (H&E stain, 200X).
Histopathological show for renal from diclofenac group (D.C.) female rabbit shows: necrotic-eosinophilic transitional epithelium with vacuolation and mild atrophy of inner muscular layer. (H&E stain, 200X).

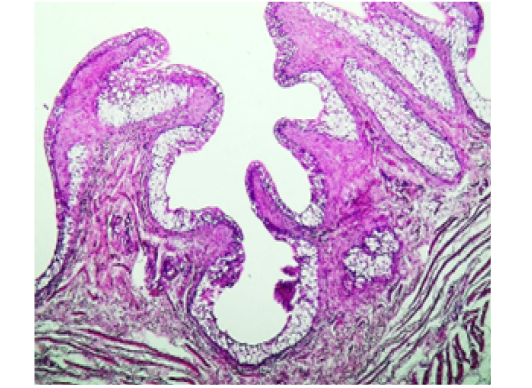
Histopathological show for urinary bladder from combination COM1)female rabbit shows: atrophic- folding of transitional epithelium. (H&E stain, 40X).

Histopathological show for renal from combination group (COM2) female rabbit shows: thickening of transitional epithelium with vacuolation and mild atrophy of inner muscular layer. (H&E stain, 200X).

