Appraisal of Soil Erosion through RUSLE Model and Hypsometry in Chakwal Watershed (Potwar-Pakistan)


Research Article
Appraisal of Soil Erosion through RUSLE Model and Hypsometry in Chakwal Watershed (Potwar-Pakistan)
Saira Batool1, Safdar Ali Shirazi1 and Syed Amer Mahmood2*
1Department of Geography, University of the Punjab, Lahore, Pakistan; 2Department of Space Science, University of the Punjab, Lahore, Pakistan.
Abstract | This research deals with soil removal assessment through the RUSLE model hypsometry and spatial autocorrelation incorporated with GIS in the Chakwal watershed-Potwar- Pakistan. It is observed that 70.06% of the Chakwal watershed lies in the tolerable (low erosion), 16.51% in the intermediate range and 13.44% in highly eroded zones of the total Chakwal watershed area. Chakwal watershed is a rainfed and semi-arid with a drainage contributing area of 6524 km2. The RUSLE factors were calculated through vulnerable erosion zones remote sensing datasets demarcated by GIS. Computed soil erodibility, rainfall erodibilty, topographic-length-slope, crop management and conservation factor reveal interesting results and are in accordance with the local estimations that agree with each other well. The output maps indicate that the approximated total possible soil loss annually of about 92.6 million tons is equivalent to the calculated sediments of 148 tons/ha. Chakwal watershed is acutely facing severe erosion due to its soil characteristics and topography. The outputs generated from this research are a way forward to plan and implement strategies for combating erosion and natural resources protection. It is inevitable to make suitable water harvesting structures and control rainwater to stop soil removal and water provision for the lean season in this rain-fed region. The results obtained can help realize that conservation practices and soil management can decreas soil erosion. The hypsometric and spatial autocorrelation investigations are in agreement with the results obtained from RUSLE technique. Tree plantation, check-dams and strip cropping can also reduce soil loss when implemented in critical areas highlighted in this research.
Received | March 11, 2021; Accepted | April 17, 2021; Published | May 29, 2021
*Correspondence | Syed Mahmood, Department of Space Science, University of the Punjab, Lahore, Pakistan; Email: amerpakistan@gmail.com
Citation | Batool, S., S.A. Shirazi and S.A. Mahmood. 2021. Appraisal of soil erosion through RUSLE model and hypsometry in Chakwal Watershed (Potwar-Pakistan). Sarhad Journal of Agriculture, 37(2): 594-606.
DOI | https://dx.doi.org/10.17582/journal.sja/2021/37.2.594.606
Keywords | Soil erosion, RUSLE, Remote sensing, GIS, Chakwal watershed, Potwar plateau
Introduction
In the past few decades, the impacts of soil erosion on food production and natural resources have increased globally (Prasannakumar et al., 2012; Zerihun et al., 2018; Ghafari-Gushe et al., 2018; Fayas et al., 2019; Thapa, 2020; Borrelli et al., 2020; Tamiru and Wagari, 2021). Specifically, in mountainous regions, soil loss results in severe natural hazards, such as heavy rainfall episodes, surface/stormwater flow on bare-lands that leads to land degradation (Ristić et al., 2012; Djoukbala et al., 2018). Pakistan being an agricultural country, is facing degradation of land, resulting in low crop production (Shah and Arshad, 2006). The most significant category of soil degradation in overall erosion is viewed as a leading factor across the whole agricultural world (Ashraf et al., 2000). The elimination of topsoil results in erosion caused by the fluvial as well alluvial drainage network, ice or wind and badly disturbed agricultural land by influencing water ecosystem, landscape development, soil fertility, crop production and environmental management (Ashraf et al., 2002; Lal, 2003, 2017; Bakker et al., 2005; Zerihun et al., 2018; Ghafari-Gushe et al., 2018, Abdulkadir et al., 2019). Rainfed spatial bands (RSBs) are rigorously affecting improper land uses due to erosion, over-grazed scenarios and prohibited cutting of connected vegetation and trees (Khan et al., 2012). Enhanced land erosion in RSBs and the potential agents accountable for this hazard including improper land uses to grow incompatible crops, overgrazing of livestock in the context of rangeland capacity and illegal deforestation (Irshad et al., 2007). Regions with higher rainfalls with the steepest slopes are commonly vulnerable to fluvial erosion, principally in plateau type Potwar region (PTPR) (Shah and Arshad, 2006). Soil loss is an acute problem in the Potwar region as different contributing factors such as terrain and climate conditions increase sedimentation and runoff. The investigation site is situated at the apex of the most extensive irrigation system in the world. Overlooking the phenomenon may lead to the distribution of water reduction and eventually influence the food water. The areas under higher erosion comprise the majority of the steep slopes with less vegetal cover. Deforestation, land-use, urbanization and variations in other anthropogenic activities can considerably add to erosion and gets rigorous along steeper slopes (Farhan and Nawaiseh, 2015). RUSLE was adopted and performed by many researchers to predict erosion due to its precision in erosion estimation. Because of financial constraints, limited practical data and difficulties, a limited ground-truthing was performed. The rationale behind is the non-availability of the requisite data and constraints regarding erosion prediction and sedimentation loads at a local/regional scale (Anton et al., 2003).
The major parts of PTPR influenced by fluvial erosion are Chakwal, Attock, Jhelum and Rawalpindi districts, including the Himalayan Mountains of Muree formation. A considerable area of the PTPR is under the influence of gully erosion, is vertically dissected with steep slopes. Piping and slumpings with apex erosion are also observed (Farooq et al., 2007; Julien, 2010; Stanchi et al., 2015). PTPR is a significant rain-fed arid zone having water stress in the context of underground resources, undulated topography with high drainage density that results in soil erosion. If this erosion cannot be stopped, it might lead to soil degradation and finally to a deserted land. PTPR is located at the zenith of River Indus Basin (IRB). Regional erosion can generate a tremendous quantity of sediments in the barrages that increase the siltation process in the already loaded barrages, which can further cause devastating floods (Ashraf, 2017). Regardless of the intensity of this problem and connected losses, the geo-spatial datasets for erosion evaluation and estimation in PTPR are insufficient. Not many appraisals described the erosion-related issues that have been performed over a watershed scale. Likewise, the spatio-temporal soil erosion information is also absent (Nasir et al., 2006). Large-scale topographic erosion estimation investigations are very significant to improve conservation of land, agricultural habits and land administration in arid regions. This information is essential for sustainable land use planners, developers and policymakers. With the availability of geomorphic indices, suitability and geomorphological mapping, hazard maps for urbanization and development of small industries is a precondition for land use assessment (Andriyanto et al., 2015; Bathrellos et al., 2017). Geospatial techniques, particularly GIS and Remote Sensing, are considered powerful tools to monitor sustainable natural resources and their management. More soil erosion (SE) generally followed by a higher rate of sedimentary processes in the local wetlands and reservoirs may decrease soil productiveness which is a serious environmental issue (Fayas et al., 2019). The SE processes are affected by bio-physical environmental parameters consisting of ground cover, climate, soil, terrain and interactions. Significant topographic characteristics affecting the process of erosion of soil are shape, length, slope and aspect. Impact of aspect and slope and show its key contribution in the runoff process (Abdo and Salloum, 2017). An increase in slope causes enhanced runoff which results in reduced infiltration. The pitch generated runoff follows its path in nearby areas and leads to soil erosion due to an increase in velocity and runoff. As a natural process, SE results from the elimination of particles from top-soil by wind or water, which is transported elsewhere. In contrast, anthropogenic activities such as forest conversion and agricultural farmings etc., would result in enhanced SE rates. Soil erosion is generated by combined parameters (climate variations, prolonged dry episodes with subsequent intense rainfall), steep slopes, inapt land cover and land use patterns (Renschler et al., 1999). Efficient modeling gives information regarding the existing situation of erosion, permit scenario investigation and its future trends. Substantial efforts have already been carried out in developing the various models for SE (Nearing et al., 2005; Bashir et al., 2013).
Besides, a detailed quantitative evaluation is required to assume on the magnitude and extent of SE issues. A coherent administrative policy can be constituted in field surveys and ground validations on a regional scale. The major issue in the context of models regarding erosion risk is confirmation due to barely available datasets to compare the different estimations from various models with tangible losses of soil (Lazzari et al., 2015; Ghani et al., 2013). Other models of SE deal with anecdotal implications. One of standard empirical soil erosion models to estimate the rill and sheet erosion is the Universal Soil Loss Equation (USLE), developed by) Wischmeier and Smith (1978). Initially, USLE was mainly designed for the estimation of soil erosion in the gentle slope topography of croplands. However, after it was enhanced and was known as Revised Universal Soil Loss Equation (RUSLE). After, modifications were made, the new index becames to be known as Modified Universal Soil Loss Equation (MUSLE) (Wischmeier and Smith, 1978; Lee and Lee, 2006).
In general, the USLE model is still prevalent in various investigations related to the estimation of soil loss. EUROSEM/MIKESHE (European Hydrological System or Systeme Hydrologique Europeen) are newly developed complete SE models with a physically based and designated character. Using conventional ways to evaluate SE risk is time-consuming and expensive. Incorporating available field data models soil erosion and data through geographic information systems (GIS) remote sensing techniques are treated as an advantage for future research (Xu et al., 2009).More recently, DEM can also be generated by using Light Detection and Ranging (LIDAR) (Jones et al. 1996). RUSLE attained widespread recognition because it is easy, simply operational and requires few time and data (Jones et al. 1996). RUSLE model can estimate potential erosion on a pixel-by-pixel basis (Shinde et al., 2010; Oweis, 2012; Lal, 2017; Djoukbala et al., 2018; Zerihun et al., 2018; Ghafari-Gushe et al., 2018; Abdulkadir et al., 2019), which is efficient while identifying the soil removal’s geospatial pattern recognition present within a sizeable topographic section. In the context of the aforementioned aspects, the present research is based on the following research objectives: (1) to implement a technique that corroborates GIS and remote sensing with RUSLE to compute geospatial dissemination of soil removal at watershed scale; (2) to investigate the effect of changes of land cover/land use on soil erosion using geospatial techniques and (3) to demarcate probability zones of soil erosion through overlay technique.
The Chakwal district (Figure 1) is situated on the South-Western side of PTPR, northern Punjab, Pakistan. Drainage network spread out their streams during rains and engage the entire valley floor. This investigation’s major objective is to incorporate RUSLE and geo-spatial techniques to evaluate the SE in Chakwal basin. The parameters RUSLE model has been computed based on land cover, rainfall data, soil types and DEM (Table 1). Following techniques have been employed in this research and is shown in Figure 2.
Table 1: Description of data type and its sources.
|
Data type |
Source |
Description |
|
Digital Elevation Model (DEM) |
SRTM, 30 m resolution |
|
|
Satellite Image |
Landsat 8, 30 m resolution |
|
|
Soil Data |
Land and Water Development Division |
Soil map for the year of 2003 |
|
Rainfall Data |
Pakistan Meteorological Department |
Rainfall data for a period of 8 years |
Study area
Geographically, the study area lies in the rainfed Potwar region of Punjab-Pakistan (Figure 1). This soil loss is estimated by RUSLE model in the district Chakwal. The Chakwal district is acutely affected by SE due to its topographic and soil nature. Chakwal is situated in Punjab at 33°40′38″ N latitude 72°51′21″E longitude. The yearly rainfall in Chakwal varies from 460 to 1640 mm, with 65% rainfall in monsoon (Cheema and Bastiaanssen, 2012). Numerous seasonal tributaries of Soan River in the study area, which agreed, follow its northern boundary (Ghani et al., 2013). Chakwal watershed is much prone to SE, having deep water table, rolling topography and compound channel network. Geologically Chakwal district can be categorized into different types of mountain topographies, rocks, hills, plains, weathered rocks, piedmont basins, plains, loess and river plains (Ullah et al., 2018). The regional soil is developed by the transported materials of wind and water. A part of the soil has also been derived from shales and sandstone. Generally, the vegetation of the study area consists on dry deciduous scrub. Chakwal lies in the sub-tropical regions. Chakwal reflects the highly variable precipitation pattern that could pose the agriculture practices in the area to a high level of uncertainty in terms of sustainable crop production.
Materials and Methods
Issues connected with the erosion of soil, deposition and movement of sediments in lakes, rivers and estuaries continue throughout the geochronological ages on the entire earth. However, in recent times the condition gets worst with anthropogenic interference within the environment. Thus, a viable action is to build up the use of empirical models. The insufficiency of datasets such as rainfall intensity, sediment deposits at smaller gaps (approximately < 30 mins) in the investigation site has restricted the choice for the collection of data concentrated models such as WEPP, USPED and Soil and water assessment tool (SWAT). Accordingly, RUSLE was chosen and performed in Chakwal district. It needs land cover and land use plan that can be produced by soil types conservation practices, remote sensing images and properties. Another benefit of RUSLE is the parameterization that can be coupled with GIS for better investigation.
Computation of RUSLE parameters
This research begins with the extraction of Chakwal basin using River tools v2 (river tools is an American software that does use Interactive data language (IDL). Afterwards, MATLAB was used for the sink filling purpose to generate a seamless DEM using D8 Then, ArcGIS 10.1 software was used to perform computation process for the RUSLE parametrs in math Algebra using SRTM DEM (that was originally in 1arc sec, I converted it to UTM, then resampled to 30m. The fundamental postulation of RUSLE is that sediment types from the flow accumulation restrict the deposition and detachment. When the sediment’s load reaches the transport capacity of the flows, detachment does not take place. RUSLE was performed to assess soil SE at annual basis.
RUSLE uses significant contribution values commonly available in obtainable datasets. Figure 4 shows extracted satellite images and DEM. Several parameters like slope extracted from LU/LC from satellite imagery and DEM are thoroughly incorporated with RUSLE. Usually, this model may not be helpful for larger watersheds (Nearing et al., 2005). RUSLE is performed to the Chakwal Basin as grids and computing SE for individual cells (Wischmeier and Smith, 1978; Shinde et al., 2010; Oweis, 2012; Lal, 2017; Djoukbala et al., 2018; Zerihun et al., 2018; Ghafari-Gushe et al., 2018; Abdulkadir et al., 2019). RUSLE computes average erosion anticipated on regional slopes by the following Equation 1.
A = R x K x LS x C x P........ (1)
“A” represents computed spatiotemporal average SE in a unit area. The units chosen for K and for time preferred for R. R is the index of rainfall-induced erosion plus a feature for any important run-off from snow-melting. K as SE parameter; L is factor over slope-length; S is steepness of slope parameter; C is a LU/LC management parameter; P is a support practice factor. RUSLE parameters are classified as, erodibility, management factors erosivity.
Rainfall erosivity factor (R)
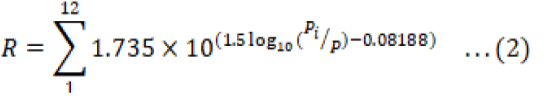
R factor reveals the impact of rainfall intensity for SE and needs complete, constant rain dataset for its computation (Wischmeier and Smith, 1978). Factor R of peak intensity of rainfall sustained over a prolonged period. Preceding appraisals signify that soil removal from fields with cultivation is related to the intensity and energy and of every rainfall event. R value must measure the significance of rainfall influence and should reveal the quantity and run-off rate connected to the rainfall. R factor is generally computed from rainfall intensity data using Equation 2 and show in Figure 3a.
SE factor (K)
K-factor reveals the soil vulnerability to erosion, sediment transport and the amount of run-off rate. The K-factor’s standard condition is the unit plot, 23.5 m longer having 10 % slope gradient, sustained in constant fallow, down-slope and tilled up along the hill (Kim, 2006). K-factor is calculated on the basis of soil texture. K-value reveals the soil removal rate per rain-fall-run-off R-factor. K-Factor from Equation 3 shown in Figure 3c is best attained from directly measured on normal run-ff plots. A nomogram is used to compute K-factor based on soil texture; % organic matter, % sand and % silt plus extremely fine sand, permeability and soil configuration (Wischmeier and Smith, 1978).
K=27.66xm1.14 x10-8(12-a)+0.0043(b-2)+0.0033(c-3)...... (3)
m= (Silt % + extremely fine sand % * 100 _ clay %); a = organic matter %; b= Soil code for its structure, code “1” means particulate or extremely structured or, code”2” is structured moderately, Code “3” is structured somewhat and code “4” means solid, “c” means code for profile permeability, rapid belongs to code “1”, code “2” is intermediate to rapid, code “3” is modest, fair to slow relates to code “4” is, code “5” is slow and code “6” means extremely slow.
Chakwal basin comprises changing soil properties. K-value was allocated to various soil types based on permeability, soil textures and antecedent wetness levels of the soil. The soil map shown in Figure 3b is again classified with allocated K-values (Figure 4). K-value range between 0→1, K-values close to 0 is least venerable to soil removal.
Topographic factor (LS)
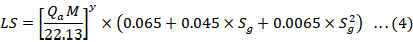
The LS represents a ratio of soil removal loss under certain conditions to that at a location with the “standard” slope steepness of 9-10% and slope length of 22-23 m. LS factor is based on two factors: length of slope (L) and steepness (S). L is the consequence of length of slope on erosion and is termed as the distance from the origin of flow accumulation to a point where the slope reaches to an extent where deposition starts or run-off water enters a well-defined channel (Remortel et al., 2001). Consequently, the soil removal per unit slope area is increased as the length of the slope increases. The S-factor shows the effect of the steep slope on erosion. The S-factor show big impacts on soil removal than slope length. If the slope is steeper, erosion becomes greater. The worst erosion is occurring between 35 and 68 degrees of slope (Figure 4a).
Consequently, the LS factor is computed using Equation 4. LS is the topographical factor; Qa is flow grid accumulation; Sg is a percentage slope grid; M is Grid size (x * y), y is an exponent that is dimensionless and assumes the value of 0.2-0.5. The percentage slope map is generated from the SRTM DEM of the Chakwal Basin and is given below in Figure 4d.
Crop management factor (C)
C-factors are significant values for the management of crops. As C-factors are unavailable for most of the Pakistani crops. Consequently, the C-factors presented by (Karaburun, 2010) inserted now have been used to signify the consequence of crop management practices on soil erosion rates in agricultural fields (Renard et al., 1997; Prasannakumar et al., 2012; Zerihun et al., 2018; Ghafari-Gushe et al., 2018; Fayas et al., 2019; Thapa, 2020; Borrelli et al., 2020; Tamiru and Wagari, 2021) changes with the system of crop yield and season. Seasonal change of C-factor relies on management practice, crop types and rainfall. Current research assumes annual variation with no sowing in (November-April or Rabi season and almost no to less rain-fall after October. The comparative effect of management practice, can be evaluated with variations in the C-factor that changes 0→1 (0 for well-protected landcover and 1 for infertile land). Therefore, the effect of C-factor over soil detachment is not significant when the land use/landcover (LU/LC) of the investigation site consists of the maximum percentage of plantation crops and forest cover. The C-factor map shown in Figure 4b was generated based on LU/LC map of the investigation site. The LU/LC of the Chakwal watershed is classified with seven LU/LC classes: Water bodies, built-up-areas, wasteland, forest area, agriculture land and bare rocks category (Figure 6) based on both ground and image information. The Landsat-8/OLI (WRS-150/37 was processed for RGB+NIR to these seven LU/LC classes through a supervised image classification technique called maximum likelyhood method with more than 45 samples with an accuracy of 88 % . This technique needs ground validations for every LU/LC category was collected both physically in the field, The general precision of the supervised scheme of classification is 85%. The area related with each LU/LC classes is computed and C-factors are allocated (Table 2) and C-values utilized in this research according to (Kim et al., 2005). The LU/LC map was re-classified again on the basis of C-value to generate the map of C-factor.
Table 2: K-factor values prepared from soil erosion map.
|
Sr. No |
Class name |
K-Factor |
|
1 |
Calcareous-loamy-soil |
0.32 |
|
2 |
Loamy soil |
0.31 |
|
3 |
Calcareous loamy-clayey soil |
0.18 |
|
4 |
Continuous soil over mountainous land |
0.18 |
|
5 |
Non-calcareous-clayey-soil |
0.12 |
|
6 |
Calcareous clayey-soil |
0.09 |
|
7 |
Sand dunes-mixed soil |
0.04 |
|
8 |
Urban |
0.01 |
Land management factor (P)
The P-factor shows the ratio between soil erosion by a support practice and straight-row farming up and down the slope and is used to report the positive effects of support practices. The P-factor is responsible for control practices that decrease the potential of run-off by their impact on spatial drainage patterns, runoff velocity, run-off concentration and hydraulic forces and geometries experienced by run-off on soil. The P-factor value ranges from 0→1, the value of 0 represents land management practices and 1 means poor conservation management practice (Figure 5a). Because of field data shortage regarding the support practices in the Chakwal watershed, so a P-value of 0.5 was chosen as the investigation site is not covered by vegetation.
Delineation of SE susceptible zones
In the RUSLE model context, the topographic factor, soil erodibility and rain erosivity are taken as natural factors to determine the erosion developments. Jointly, they can be attributed to potential or vulnerable soil erosion of the area. (Shit, 2019; Chuenchum et al., 2020) for identifying and mapping the soil erosion vulnerable areas, different thematic maps were generated and integrated in the GIS environment (Fistikoglu, 2001). Main factors influencing soil erosion comprise slope, LU/LC, rainfall amount and soil properties. The individual themes were assigned different weights in the context of their roles towards soil erosion. Feature with maximum vulnerability is set highest value and lowest vulnerable feature with minimum value.
Results and Discussion
Rainfall erodibility to avoid similarity index factor (R)
Many researchers (Dabral et al., 2008) discovered that soil erosion rates are responsive to rain-fall within a catchment. Diurnal rainfall factor is an excellent indication of variations in the SE rates to describe the seasonal distributions of soil sediments. In comparison, the benefits of yearly rainfall have its swift accessibility, better regional reliability and simple computation (Shinde et al., 2010). Consequently, in the current investigation, average yearly (total rainfall / total rainy days) rainfall was incorporated for R factor computation (Equation 2). The estimated R factor value ranges from 106.6 to 99.8 MJ/mm.ha-1hr-1/year (Figure 3a). It is observed that rainfall is high in NNE region of Chakwal watershed, as shown in the R-factor map.
SE factor (K)
The values of K-values were allocated to individual soil types to prepare the map for soil erosion (Figure 3c). K-values range from 0.02-0.3. The low K-value is connected to the soils representing low seepage capacity and lower content of antecedent moisture.
Topographic factor (LS)
Southeast, the hilly and uplifted areas including salt range thrust with higher LS-value that enhances in final SE. LS-map (Figure 3d) demonstrates the topographic complexity that makes it more susceptible for soil loss. The LS-factor stands for the control of slope steepness and slope length on erosive development. LS-factor was computed by taking the slope in percentage and flow accumulation as input datasets. This investigation found that LS-value increases in a range of 0→1.653 with the increase in slope and accumulation of flow.
Crop management factor (C)
Land use information allows an improved picture of the land consumption characteristic of crops pattern, water bodies, forest, fallow land, wasteland and bare surface that are essential for studies related to erosion, planning and development. Geospatial techniques are capable to produce thematics of LU/LC for a given region which has been grouped into six LU/LC classes (Figure 4d). C-factor values were attributed to various LU/LC classes using the values given in Table 3.
Table 3: Land use/land cover classes from satellite imagery.
|
Sr. No |
Class name |
Area (ha) |
Area (%) |
|
1 |
Water |
9088.594023 |
1.41478 |
|
2 |
Urban |
18387.32751 |
2.86227 |
|
3 |
Soil |
64178.3049 |
9.99033 |
|
4 |
Agriculture |
154249.3114 |
24.0113 |
|
5 |
Waste Land |
280558.2847 |
43.6732 |
|
6 |
Bare Rock |
94987.71369 |
14.7863 |
|
7 |
Forest |
40954.71056 |
6.37523 |
C-factor map (Figure 4b) was prepared using the LU/LC map and C-factor values’ spatial distribution. In this research, the C-factor ranges from 0.001-0.004 in forested region and 0.45 in barren area. C-factor values correspond to the typically used value of C-factor for Barren lands/bare soils, i.e., 0.45 and while built-up areas is 0.000 (Roose, 1996).
The GIS investigation is performed to compute Gross total of SE which is 702,03 t/yr by RUSLE technique (Figure 5b). Forest cover once covered south-eastern part of the chakwal watershed has undergone severe deforestation, making it vulnerable to rigorous erosion (Farhan and Nawaiseh, 2015). First largest contributor (Barren land) produces 43% soil loss in the Chakwal watershed. This is because of the non-availability of small vented dams (“check dams”) made across the slopping of chakwal watersheds. Using GIS-based classification, the map for soil loss assessment was classified again and a map of soil loss severity was produced. The map in (Figure 6c) displays the severity of soil erosion in the Chakwal watershed into three classes on a severity basis, i.e. high, intermediate and low erosion (Figure 5c). These classes are extremely localized and are based on the experience of local expert involved in SE degradation and evaluation of land. It is observed that 70.06% of the Chakwal watershed falls in the low erosion scenario, 16.51% in the intermediate range and 13.44% in highly eroded zones of Chakwal watershed. Table 3 presents the erosion severity classes, the array of yearly soil loss in an individual class and the area under each erosion severity classes (ESC).
Table 4 shows the yearly soil erosion in various parts of Chakwal district. It is observed that significant annual soil erosion occurs in the southern and South-East of the watershed. The ESC map shown in Figure 5c reveals that this soil erosion is due to the hilly, sloppy areas of the western section of salt range thrust and barren areas that are vulnerable to rigorous soil loss. Enhanced deforestation and clearing of natural vegetation due to human interventions is also a reason of higher rate of soil loss in the Chakwal watershed. Sediment yield map (SYM) in Figure 6c shows that soil loss is maximum in areas with sandy soil, steeper slopes and scrub-lands and is as higher as 148 tons/ha.
Table 4: Categories of soil erosion, area and the amount of soil loss.
|
Erosion categories |
Numeric Range (t/ha/yr) |
Area (ha) |
Area % |
|
Low Erosion |
0 - 1000 |
463817.781 |
70.06 |
|
Moderate Erosion |
1000 - 10000 |
109277.897 |
16.51 |
|
High Erosion |
10001 - 702030 |
88948.779 |
13.44 |
Table 5: Categories of soil erosion, area and the amount of soil loss.
|
Sr. No. |
District |
Total annual soil loss (Millions tons) |
|
1 |
Chakwal |
92.6 |
Soil erosion shows a close correlation with LU/LC. For this reason, Satellite imagery was re-classified by reducing forest cover and enhancing agriculture land. Changes in agricultural areas were attained by evaluating with initially prepared LU/LC map. C-factor for the enhanced agricultural land (Table 3) was retrieved from Landsat satellite imagery. The increase in soil loss has arisen because of increase in agricultural land and is observed due to the agricultural practices like land preparation, tillage and ploughing etc.
Hypsometric integral (HI)
Hypsometry is sensitive to lithologic borders and tectonic uplifts. In this study we calculated hypsometric integral Values (HIVs) using as 90 m SRTM DEM in the Chakwal watershed in PTPR. Application of hypsometric technique shows a strong correlation between the main distribution of anticlines and higher or lower HIVs clusters obtained in our investigation. High values of HIVs are present in almost entire Chakwal watershed basin, the distribution of HIVs correspond to the distribution of anticlines in investigation area (Figure 6a). Higher HIVs are clustered along the NE-SW oriented faults (Figure 6a), where neotectonic activity exists. Lower HIVs are found in recent sedimentation regions in the Holocene era along the hanging walls of active faults and are representative of high erosion. Numerous procedures can clarify these high HIVs far away from fault scarps. Epeirogenic tectonic uplift produced higher HIVs in the zones where the localized exogenic impact does not encounter topographic uplift. Some bonus topographic uplift may result from the fold and thrust topography related to the Kallar Kahar anticline.
Spatial auto-correlation of hypsometry (SACH)
The Chakwal watershed is a comparatively gentle to intermediate topography (217–1310 m) that comprises fold and thrusts, anticlines, synclines and some peneplain segments. Higher HIVs groups are disseminated spatially along Chak Naurang, Dhadhumbar, Jhatia, Tamman, Balkassar and Karsal). Conversely, Low HIVs groups are observed along Kallar Kahar and Dill-Jabba (Figure 6b) faults Southeast segment of Salt Range Thrust showing active sediments (Mohadjer et al., 2010) which is in agreement with the erosional scenario computed from the RUSLE.
The results obtained are beneficial for the natural resource managers, planners and decision makers to control sediment yield into the water reservoirs. Such investigations must be performed in the PTPR with higher rainfall to evaluate the possible risk in the national perspective. This will identify preferred areas to implement and. plan strategies to control erosion and land degradation issues (Bathrellos et al., 2017). For the Potwar in general and Chakwal watershed in specific, this evaluation is very helpful, particularly enhanced deforestation and adaptation of landuse patterns. Quantification of erosion loss in the Chakwal watershed will enable appropriate structures for water harvesting which will not only supply water in the off-rain season but also minimize the soil loss within the Chakwal watershed. Conservation and management practices such as strip cropping, tree plantations, check dams must be promoted to reduce the soil loss in this region.
Conclusions and Recommendations
This research reveals the practical SE RUSLE model application incorporated with GIS to approximate SE potential and vulnerable zones in Chakwal watershed. This investigation signified that PTPR region is extremely prone to SE and if the SE continues at this pace, it might lead and aggravates the degradation of Chakwal watershed soil. Hence, it may lead to deserted region, causing the cultivable and fertile land inappropriate for cultivation and farming and ultimately becomes a region for food security. Average yearly soil removal was estimated 18 tons/ha/year and highest erosion (70–203 tons/ha/year) in the vicinity of the river tributaries and hilly regions. Transported sediment flux yield due to SE is as much as 148 tons/ha/year. SE highly influences Chakwal watershed due to its soil characteristics topographic nature. The massive amount sediments generated in the barrages and streams may severely affect the already loaded barrages and canals. The application of geospatial spatial autocorrelation and HIVs hot and cold spots allows us to decipher the erosion and recent sedimentation within the Chakwal district. This research generated valuable information regarding the classes based on the severity of erosional intensity and sediment flux yield. It will assist the planners , policy and decision-makers, soil research and conservation institutes to concentrate on the extremely vulnerable eroding zones. Hence it is highly recommended that appropriate rain and stream water harvesting constructions and other support practices should be prepared to stop the SE in Chakwal.
The novelty of this research, is to assess the soil erosion using RUSLE Model and Hypsometry in Chakwal watershed in the Potwar region, Pakistan. It was found that medium to the high slopes, salt topography and enhanced erosion makes the local topography a bit unsuitable for agricultural practices.
Author’s Contribution
This research is a part of Ph. D. study of Ms. Saira Batool (S.B). This research was generated by S.B and refined by Syed Amer Mahmood and Safdar Ali Shirazi. S.B collected and analyzed the data and overall managed the study S.A Mahmood and S.A Shirazi provided technical input to refine this.
Conflict of interest
The authors have declared no conflict of interest.
References
Abdulkadir, T.S., R.U.M. Muhammad, K.W. Yusof, M.H. Ahmad, S.A. Aremu, A. Gohari and A.S. Abdurrasheed. 2019. Quantitative analysis of soil erosion causative factors for susceptibility assessment in a complex watershed. Cogent Eng., 6(1). https://doi.org/10.1080/23311916.2019.1594506
Ashraf, A., 2017. Modeling risk of soil erosion in high and medium rainfall zones of Pothwar region: Pakistan. Proc. Pak. Acad. Sci. Pak. Acad. Sci. B. Life Environ. Sci., 54: 67–77.
Altaf, S., G. Meraj and S.A. Romshoo. 2014. Morphometry and land cover based multi-criteria analysis for assessing the soil erosion susceptibility of the western Himalayan watershed. Environ. Monit. Assess., 186: 8391–8412. https://doi.org/10.1007/s10661-014-4012-2
Ashraf, M. and M. Khan. 2000. Sustainable environment management: Impact of agriculture. Sci. Techol. Dev., 19: 51–57.
Ashraf, M., Hassan, F., Saleem, A. and Iqbal, M. 2002. Soil conservation and management: A prerequisite for sustainable agriculture in Pothwar. Sci. Techol. Dev., 21: 25–31.
Andriyanto, C., S. Sudarto and D. Suprayogo. 2015. Estimation of soil erosion for a sustainable land use planning: RUSLE model validation by remote sensing data utilization in the Kalikonto watershed. J. Degrad Min. Lands Manag., 3(1): 459–468.
Anton, J.J., V. Rompaey, P. Bazzof, J.J. Robert, L. Montanarella and G. Goversn. 2003. Validation of soil erosion risk assessments in Italy. European soil bureau research report no.12, EUR 20676 EN. Office for Official Publications of the European Communities, Luxembourg.
Abdo, H. and J. Salloum. 2017. Mapping the soil loss in Marqya basin: Syria using RUSLE model in GIS and RS techniques. Environ. Earth Sci., 76: 114. https://doi.org/10.1007/s12665-017-6424-0
Bakker, M.M., G. Govers, C. Kosmas, V. Vanacker, K. Van Oost and M. Rounsevell. 2005. Soil erosion as a driver of land-use change. Agric. Ecosyst. Environ., pp. 1-15. https://doi.org/10.1016/j.agee.2004.07.009
Bathrellos, G.D., H.D. Skilodimou, K. Chousianitis, A.M. Youssef and B. Pradhan. 2017. Suitability estimation for urban development using multi-hazard assessment map. Sci. Total Environ., 575: 119–134. https://doi.org/10.1016/j.scitotenv.2016.10.025
Bashir, S., M. Baig, M. Ashraf, M. Anwar, M. Bhalli and S. Munawar. 2013. Risk assessment of soil erosion in rawal watershed using geoinformatics techniques. Sci. Int., 25: 583–588.
Borrelli, P., D.A. Robinson, P. Panagos, E. Lugato, J.E. Yang, C. Alewell, D. Wuepper, L. Montanarella and C. Ballabio. 2020. Land use and climate change impacts on global soil erosion by water (2015-2070). Proc. Natl. Acad. Sci. U.S.A., 117(36): 21994–22001. https://doi.org/10.1073/pnas.2001403117
Cheema, M.J.M. and W.G.M. Bastiaanssen. 2012. Local calibration of remotely sensed rainfall from the TRMM satellite for different periods and spatial scales in the Indus Basin. Int. J. Remote Sens., 33: 2603–2627. https://doi.org/10.1080/01431161.2011.617397
Chuenchum, P., X. Xu and W. Tang. 2020. Estimation of soil erosion and sediment yield in the lancang–mekong river using the modified revised universal soil loss equation and GIS techniques. Water, 12: 135. https://doi.org/10.3390/w12010135
Dabral, P.P., N. Baithuri and A. Pandey. 2008. Soil erosion assessment in a hilly catchment of North Eastern India using USLE, GIS and remote sensing. Water Resour. Manage., 22: 1783-1798.
Djoukbala, O., M. Mazour, M. Hasbaia and O. Benselama. 2018. Estimating of water erosion in semiarid regions using RUSLE equation under GIS environment. Environ. Earth Sci., 77: 345. https://doi.org/10.1007/s12665-018-7532-1
Farooq, U., A. Munir and A.W. Jasra. 2007. Natural resource conservation, poverty alleviation and farmer partnership. Pak. Dev. Rev., 46: 4 Part II (Winter 2007), pp. 1023. https://doi.org/10.30541/v46i4IIpp.1023-1049
Farhan, Y. and S. Nawaiseh. 2015. Spatial assessment of soil erosion risk using RUSLE and GIS techniques. Environ. Earth Sci., 74: 4649–4669. https://doi.org/10.1007/s12665-015-4430-7
Fistikoglu, Okan, Harmancioglu and B. Nilgun. 2002. Integration of GIS with USLE in assessment of soil Erosion. Water Resour. Manage., 16: 447-467. https://doi.org/10.1023/A:1022282125760
Fayas, C.M., N.S. Abeysingha. D. Samaratunga and A. Mallawatantri. 2019. Soil loss estimation using RUSLE model to prioritize erosion control in Kelani river basin in Sri Lanka. Int. Soil Water Onserv. Res., https://doi.org/10.1016/j.iswcr.2019.01.003
Ghafari-Gushe, H., M. Gorji and M. Arabkhedri. 2018. Evaluation period of soil erosion olerance in watershed scale based on fertility and soil quality (Haji Ghoshan basin of Gorgan province). Soil Water Res., 48(5): 985–994 (In Persian).
Ghani, M.W., M. Arshad, S. Abdul, S. Aamir, M. Nasir and A. Ijaz. 2013. Investigation of potential water harvesting sites at Potohar using modeling approach. Pak. J. Agric. Sci., 50: 723–729.
Sakinatu, I. and A.A. Muhammad. 2017. Impact of soil erosion and degradation on water quality: A review. Geol. Ecol. Lands., 1(1): 1-11. https://doi.org/10.1080/24749508.2017.1301053
ICARDA, 2016. https://apps.icarda.org/wsInternet/wsInternet.asmx/DownloadFi leToLocal?filePath=Working_Paper_Series/OASIS/OASIS_3_Pakistan.pdfandfleName=OASIS_3_Pakistan.pdf. Accessed 22 Feb 2016.
Irshad, M., M. Inoue, M. Ashraf, H.K.M. Delower and A. Tsunekawa. 2007. Land desertifcation: An emerging threat to environment and food security of Pakistan. J. Appl. Sci., 7: 1199–1205. https://doi.org/10.3923/jas.2007.1199.1205
Jones, F. T., M.J. Wineland, J.T. Parsons and W.M. 1996. Degradation of aflatoxin by poultry litter. Poult. Sci., 75(1): 52-58
Julien, P.Y., 2010. Erosion and sedimentation, 2nd edn. Cambridge University Press, Cambridge, pp. 1139486969 (ISBN-10).
Karaburun, A., 2010. Estimation of C factor for soil erosion modeling using NDVI in Buyukcekmece watershed. Ozean J. Appl. Sci. 3(1): 77–85.
Kim, H.S., 2006. Soil erosion modeling using RUSLE and GIS on the IMHA watershed, South Korea. Doctoral dissertation. Colorado State University, USA. pp. 29-47.
Kim, B. John, Saunders, Peter, Finn and T. John. 2005. Rapid assessment of soil erosion in the Rio Lempa Basin, Central America, using the universal soil loss equation and geographic information systems. Environ. Manage., 36: 872-885. https://doi.org/10.1007/s00267-002-0065-z
Khan, M., A. Munir and H. Hashmi. 2012. Review of available knowledge on land degradation in Pakistan. OASIS Country Report 3.
Lal, R., 2003. Soil erosion and the global carbon budget. Environ. Int., 29: 437–450. https://doi.org/10.1016/S0160-4120(02)00192-7
Lal, R., 2017. Soil erosion and global warming in India. J. Soil Water Conserv., 16: 297–305.
Lazzari, M., D. Gioia, M. Piccarreta, M. Danese and A. Lanorte. 2015. Sediment yield and erosion rate estimation in the mountain catchments of the Camastra artificial reservoir (Southern Italy): A comparison between different empirical methods. Catena, 127: 323-339. https://doi.org/10.1016/j.catena.2014.11.021
Lee, G.S. and K.H. Lee. 2006. Scaling effect for estimating soil loss in the RUSLE model using remotely sensed geospatial data in Korea. J. Hydrol. Earth Syst. Sci., 3: 135-157. https://doi.org/10.5194/hessd-3-135-2006
Mohadjer, S., R. Bendick, A. Ischuk, S. Kuzikov, A. Kostuk, U. Saydullaev, S. Lodi, D.M. Kakar, A. Wasy, M. Khan, A. Molnar, P. Bilham and A.V. Zubovich. 2010. Partitioning of India-Eurasia convergence in the Pamir-Hindu Kush from GPS measurements, Geophys. Res. Lett., 37: L04305.
Nasir, A., K. Uchida and M. Ashraf. 2006. Estimation of soil erosion by using RUSLE and GIS for small mountainous watersheds in Pakistan. Pak. J. Water Resour., 10: 11–21.
Nearing, M.A., V. Jetten, C. Baffaut, O. Cerdan, A. Couturier, M. Hernandez, Y. Le Bissonnais, M.H. Nichols, J.P. Nunes, C.S. Renschler, V. Souchere and K. van Oost. 2005. Modeling response of soil erosion and runoff to changes in precipitation and cover. Catena, 61: 131-154. https://doi.org/10.1016/j.catena.2005.03.007
Oweis, T. and M. Ashraf. 2012. Assessment and options for improved productivity and sustainability of natural resources in Dhrabi Watershed Pakistan. ICARDA, Aleppo, Syria. xviii + pp. 205.
Prasannakumar, V., H. Vijith, S. Abinod and N. Geetha. 2012. Estimation of soil erosion risk within a small mountainous sub-watershed in Kerala, India, using Revised Universal Soil Loss Equation (RUSLE) and geo-information technology. Geosci. Front., 3(2): 209–215. https://doi.org/10.1016/j.gsf.2011.11.003
Renard, K., G. Foster, G. Weesies, D. McCool and D. Yoder. 1997. Predicting soil erosion by water: A guide to conservation planning with the revised universal soil loss equation (RUSLE). US Government Printing Office, Washington, DC.
Ristić, R., S. Kostadinov, B. Radić, G. Trivan and Z. Nikić. 2012. Torrential foods in Serbia-man made and natural hazards. In: 12th congress interpraevent. https://doi.org/10.5194/nhess-12-23-2012
Roose, E., 1996. Land husbandry: Components and strategy. FAO Soils Bull., pp. 70.
Remortel, R. Van, M. Hamilton and R. Hickey. 2001. Estimating the LS factor for RUSLE through iterative slope length processing of digital elevation data. Cartography, 30(1): 27e35. https://doi.org/10.1080/00690805.2001.9714133
Renschler, C.S., C. Mannaerts and B. Diekkrüger. 1999. Evaluating spatial and temporal variability in soil erosion risk - rainfall erosivity and soil loss ratios in Andalusia, Spain. Catena, 34: 209-225. https://doi.org/10.1016/S0341-8162(98)00117-9
Shinde, V., K.N. Tiwari and S. Manjushree. 2010. Prioritization of micro watersheds on the basis of soil erosion hazard using remote sensing and geographic information system. Int. J. Water Resour. Environ. Eng., 2(3): 130-136.
Shah, Z. and M. Arshad. 2006. Land degradation in Pakistan: A serious threat to environments and economic sustainability. ECO Services International. http://www.eco-web.com/edi/index.htm
Shit, P.K., 2019. Gully erosion studies from India and surrounding regions; Springer Nature: Berlin/Heidelberg, Germany. https://doi.org/10.1007/978-3-030-23243-6
Stanchi, S., G. Falsone and E. Bonifacio. 2015. Soil aggregation, erodibility and erosion rates in mountain soils (NW Alps, Italy). Solid Earth, 6: 403–414. https://doi.org/10.5194/se-6-403-2015
Tamiru, H. and M. Wagari. 2021. RUSLE model based annual soil loss quantification for soil erosion protection in fincha catchment, Abay River Basin, Ethiopia.. Preprints, 2021, 2021020526. https://doi.org/10.20944/preprints202102.0526.v1
Thapa, P., 2020. Spatial estimation of soil erosion using RUSLE modeling: A case study of Dolakha district, Nepal. Environ. Syst. Res., 9(1). https://doi.org/10.1186/s40068-020-00177-2
Ullah, S., A. Ali, M. Iqbal, M. Javid and M. Imran. 2018. Geospatial assessment of soil erosion intensity and sediment yield: A case study of Potohar Region, Pakistan. Environ. Earth Sci., 77: 705. https://doi.org/10.1007/s12665-018-7867-7
Walling, D.E., 2017. Measuring sediment yield from River Basins. In: Soil Erosion Research Methods; Routledge: London, UK, pp. 39–82. https://doi.org/10.1201/9780203739358-3
Wischmeier, W.H. and D.D. Smith. 1978. Predicting rainfall erosion losses: A guide to conservation planning. Agriculture Handbook 282. USDA-ARS, USA.
Xu, Y.Q., X.M. Shao and J. Peng. 2009. Assessment of soil erosion using RUSLE and GIS: A case study of the Maotiao River watershed, Guizhou Province, China. Environ. Geol., 56: 1643-1652. https://doi.org/10.1007/s00254-008-1261-9
Zerihun, M., S. Mohammed, D. Mohammedyasin, A.A. Adem and M. Lakew. 2018. Assessment of soil erosion using RUSLE, GIS and remote sensing in NW Ethiopia. Geoderma Region, 12: 83–90. https://doi.org/10.1016/j.geodrs.2018.01.002
To share on other social networks, click on any share button. What are these?