

Cissus quadrangularis (Hexane Fraction) Inhibits RANK-L Induced Osteoclast Differentiation of Murine Macrophage RAW264.7 Cell Line


Cissus quadrangularis (Hexane Fraction) Inhibits RANK-L Induced Osteoclast Differentiation of Murine Macrophage RAW264.7 Cell Line
Rabail Hassan Toor1,3, Raazia Tasadduq2, Jane B. Lian3, Janet L. Stein3, Gary S. Stein3 and Abdul Rauf Shakoori1*

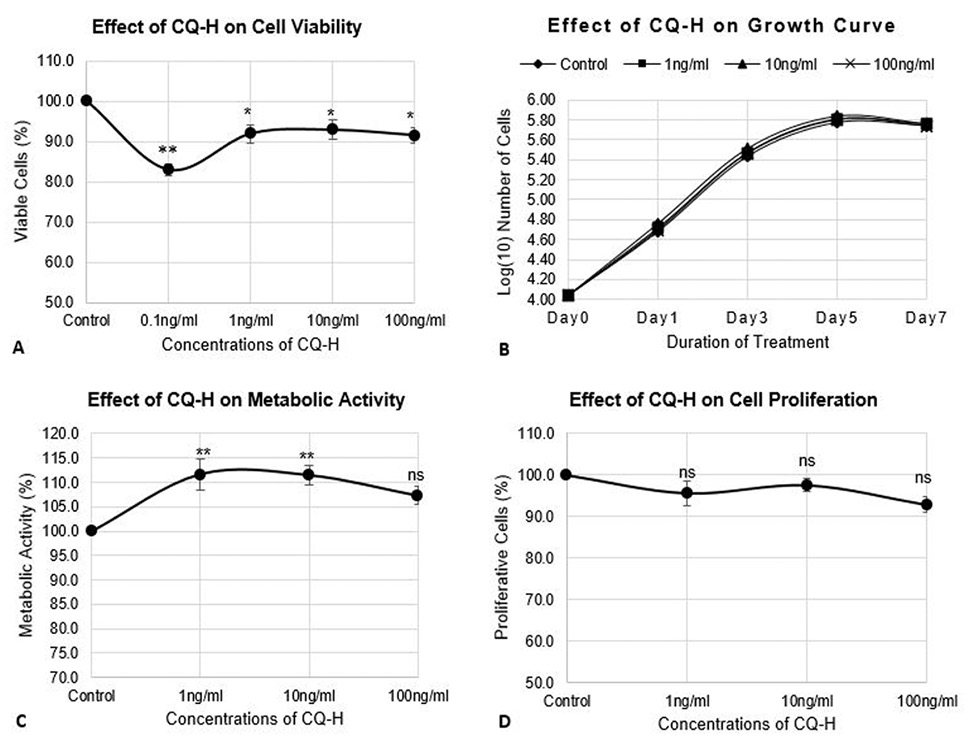
Effect of CQ-H on cell viability, growth parameters, and proliferation of RAW264.7 cell line. The cells were seeded at density of 3000 cells/cm2 in 24-well plates. The control cells were fed with 0.05% DMSO supplemented complete medium whereas, complete medium containing 1, 10, and 100 ng/ml CQ-H was fed to the treated cultures. (A) Neutral red assay was performed for analysis of cell viability. The cells were treated with CQ-H for 72h. Assay was performed at 24h and 72h. Averages of values were taken. (B) Growth curve was generated by treated cells with CQ-H for 7 days and counting them on alternate days (day 1, 3, 5, and 7). Logarithmic values of cell number were plotted to reveal lag, log, stationery and decline phase of cell growth. (C) MTT assay and (D) BrdU incorporation assay was performed to analyze effect of CQ-H on the metabolic activity and cell proliferation respectively. The cells were seeded for up to 72h and assays were performed at 24 and 72h. Averages of values were taken. Data are represented as Mean ± SD of technical and biological replicates for each experiment. For statistical analyses, ANOVA with Dunnett’s test for multiple comparison was performed using GraphPad Prism (v 7.03). (P≤0.05; ns = not significant, * P≤0.05, **P≤0.01, ***P≤0.001, ****P≤0.0001).

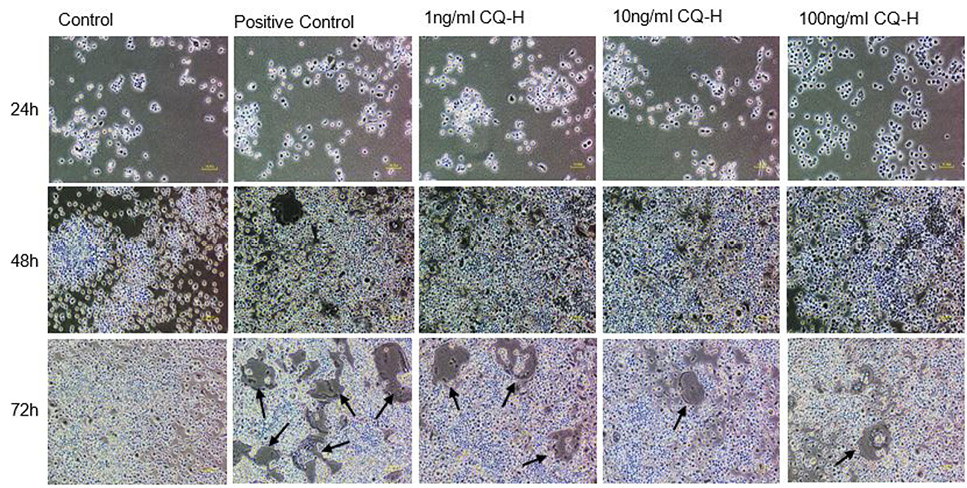
Effect of non-cytotoxic, non-detrimental concentrations of CQ-H (1, 10, and 100 ng/ml) on the differentiation of RAW264.7 cell line. The cells were cultured at 12000/cm2 density in 12-well culture plates. The control cells were fed with 0.05% DMSO supplemented medium. The positive control cells were fed with osteoclast induction medium (complete growth medium supplemented with 10ng/ml RANK-L and 0.05% DMSO). The CQ-H treated cells were fed with osteoclast induction medium containing 1, 10 and 100ng/ml CQ-H. After 48h of osteoclast induction, the cells fed with induction medium began to fuse with each other. After 72h of induction, mature, multinucleated cells were formed in the culture plate. The number of multinucleated cells was larger compared to CQ-H treated cultures. The black arrows show the large multinucleated cells. There were no large multinucleated cells in the control cultures. The images were taken at 4x magnification with Nikon Eclipse TS-100 inverted microscope.
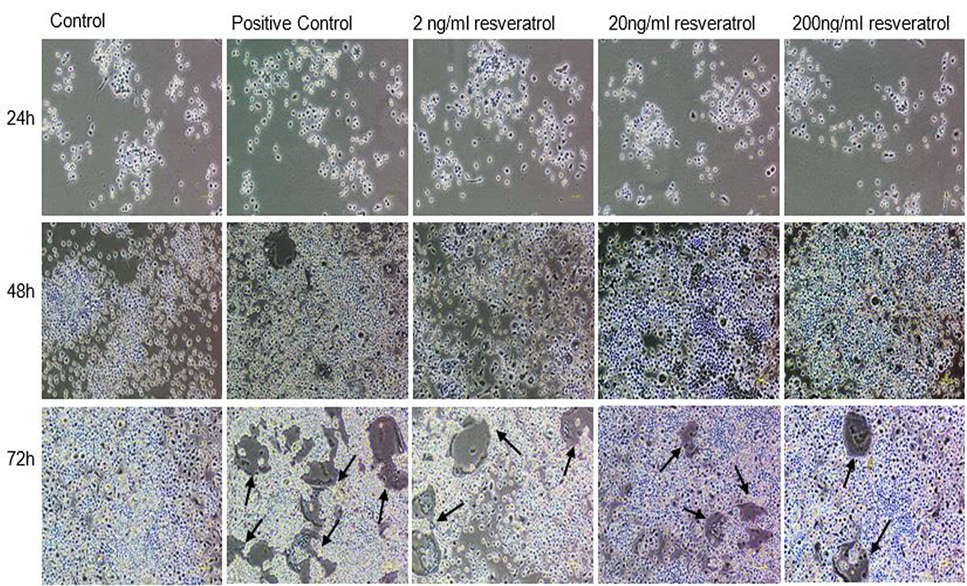
Effect of non-cytotoxic, non-detrimental concentrations of Resveratrol (2, 20, and 200 ng/ml) on the differentiation of RAW264.7 cell line. The cells were cultured at 12000/cm2 density in 12-well culture plates. The control cells were fed with 0.05% DMSO supplemented medium. The positive control cells were fed with osteoclast induction medium (complete growth medium supplemented with 10ng/ml RANK-L and 0.05% DMSO). The Resveratrol treated cells were fed with osteoclast induction medium containing 2, 20, and 200 ng/ml resveratrol. After 48h of osteoclast induction, the cells fed with induction medium began to fuse with each other. After 72h of induction, mature, multinucleated cells were formed in the culture plate. The number of multinucleated cells was larger compared to resveratrol treated cultures. The black arrows show the large multinucleated cells. There were no large multinucleated cells in the control cultures. The images were taken at 4x magnification with Nikon Eclipse TS-100 inverted microscope.

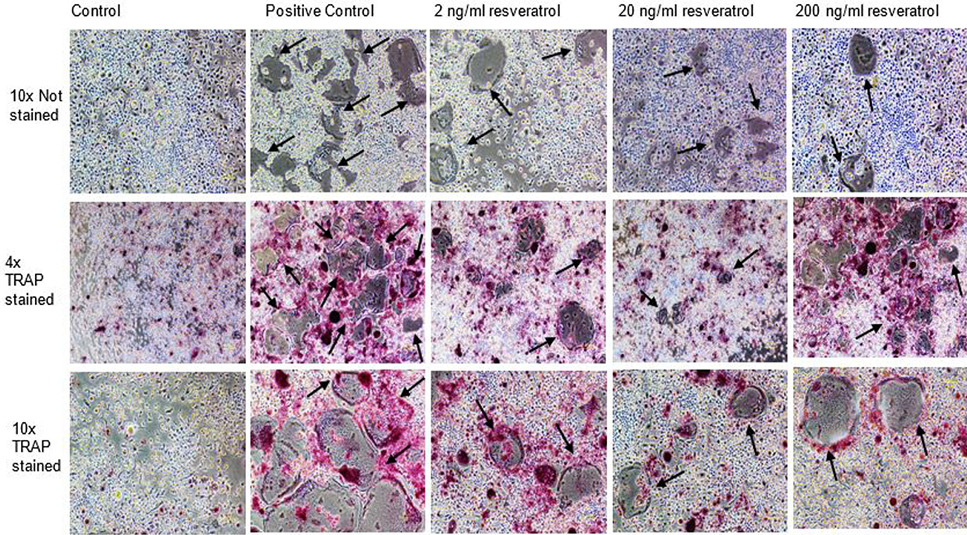
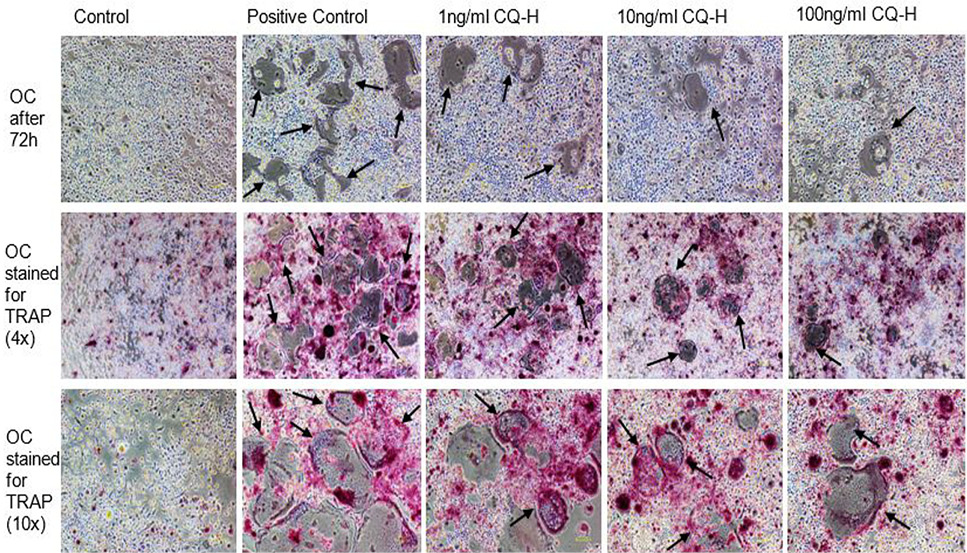
TRAP stained multinucleated cells formed after 72h of osteoclast induction of RAW264.7 cells. The images in first row show the unstained RAW264.7 cultures after 72h of induction and CQ-H treatment at 4x magnification. The second row shows the cells stained for TRAP at 4x magnification. The pink colored cells indicate presence of TRAP positive osteoclasts. The third row shows TRAP stained cells at 10x magnification. The figures indicate that the positive control cultures have more stained multinucleated cells compared to CQ-H treated cells. The black arrows show the multinucleated cells. Images were taken from Nikon Eclipse TS-100 inverted microscope.
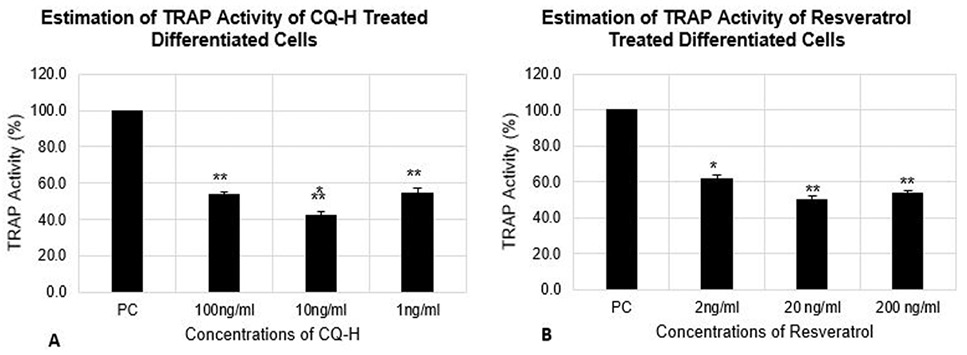
Estimation of TRAP activity of differentiated RAW264.7 cells. The cells were seeded at 12000 cells/cm2 density and differentiated for 72h. The control cells were fed with 0.05% DMSO supplemented medium. The positive control cells were fed with osteoclast induction medium (complete growth medium supplemented with 10ng/ml RANK-L and 0.05% DMSO). The CQ-H treated cells were fed with osteoclast induction medium containing 1, 10 and 100ng/ml CQ-H and Resveratrol treated cells were fed with osteoclast induction medium containing 0.002, 0.02, and 0.2 µg/ml resveratrol. TRAP activity was estimated after 72h of osteoclast differentiation induction. Data are represented as Mean ± SD of technical and biological replicates for each experiment. For statistical analyses, ANOVA with Dunnett’s test for multiple comparison was performed using GraphPad Prism (v 7.03). (P≤0.05; ns = not significant, * P≤0.05, **P≤0.01, ***P≤0.001, ****P≤0.0001).
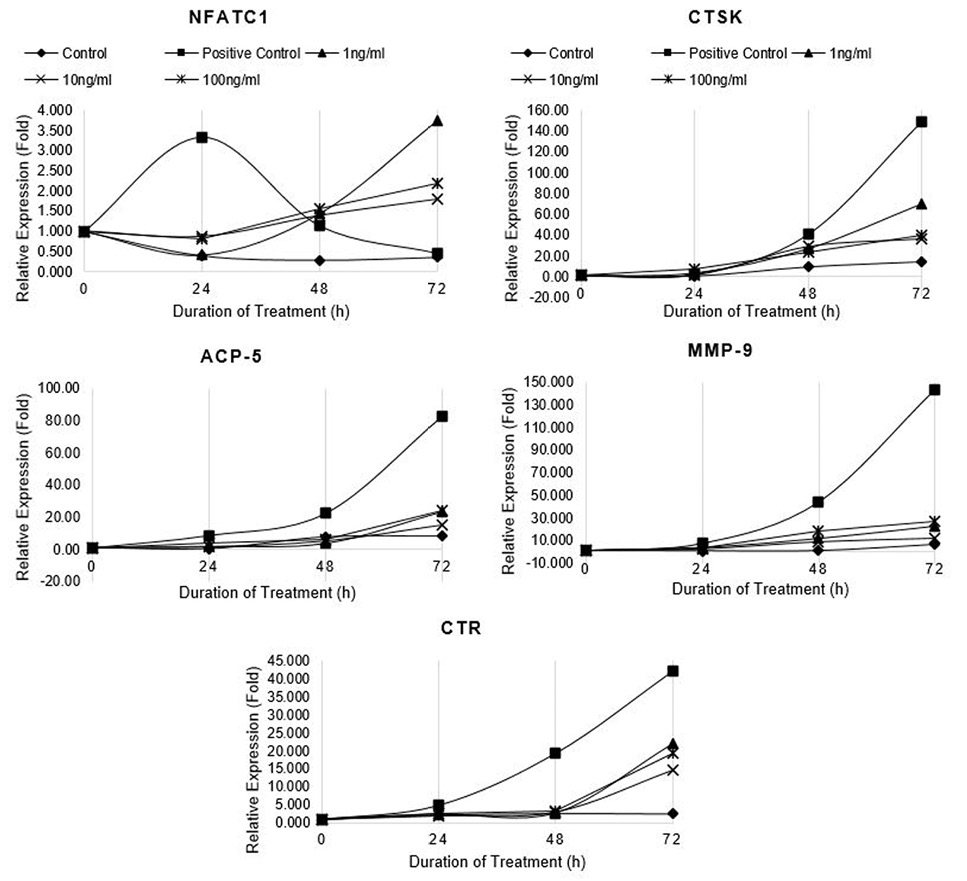
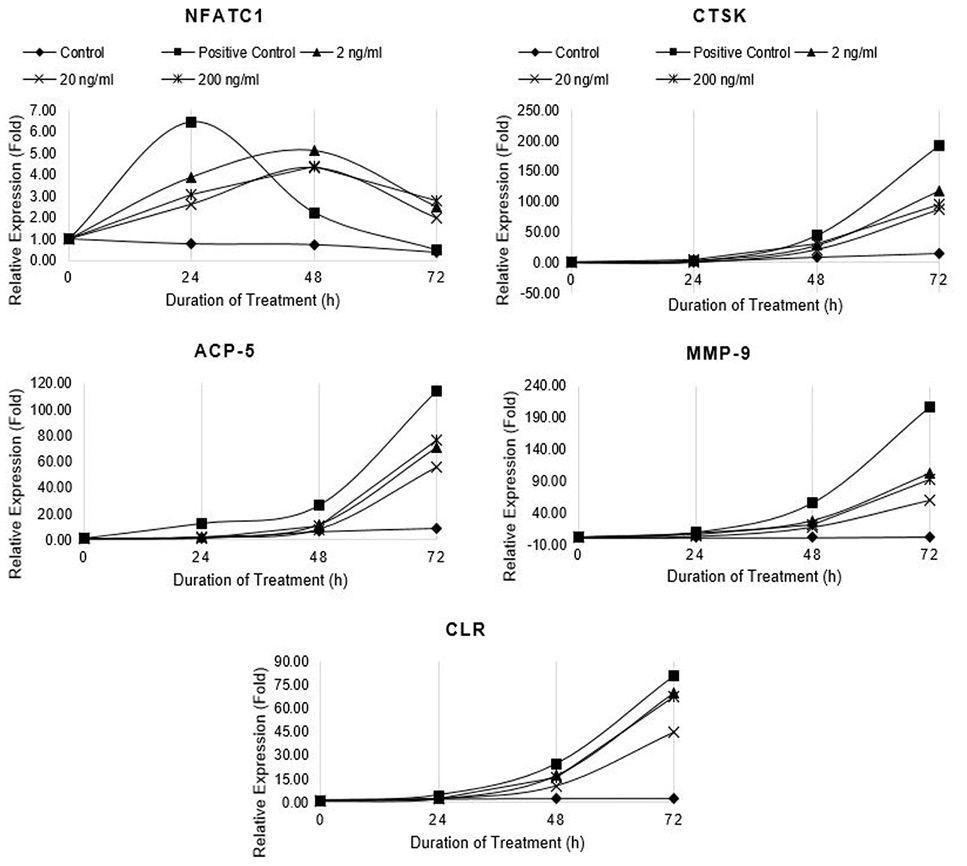
Relative expression of osteoclast marker genes (NFATc1, CTSK, ACP5, MMP-9 and CTR) in differentiating RAW264.7 cells treated with non-cytotoxic concentrations of CQ-H. Control cells were fed with 0.05% DMSO supplemented medium. The control culture was treated with 0.05% DMSO in normal complete medium. The positive control cells were fed with osteoclast induction medium (complete growth medium supplemented with 10ng/ml RANK-L and 0.05% DMSO). The CQ-H treated cells were fed with osteoclast induction medium containing 1, 10 and 100ng/ml CQ-H. The cells were allowed to differentiate for 72h with medium change after 48h. Total RNA was isolated at 0, 24, 48, and 72h of induction and cDNA was synthesized. Hydroxymethylbilane synthase (HMBS) was selected as housekeeping gene. Expression of genes was quantified by real-time. Relative expression (fold) was calculated by Pfaffl method.

Relative expression of osteoclast marker genes (NFATc1, CTSK, ACP5, MMP-9 and CTR) in differentiating RAW264.7 cells treated with non-cytotoxic concentrations of Resveratrol. Control cells were fed with 0.05% DMSO supplemented medium. The control culture was treated with 0.05% DMSO in normal complete medium. The positive control cells were fed with osteoclast induction medium (complete growth medium supplemented with 10ng/ml RANK-L and 0.05% DMSO). The Resveratrol treated cells were fed with osteoclast induction medium containing 2, 20, and 200 ng/ml resveratrol. The cells were allowed to differentiate for 72h with medium change after 48h. Total RNA was isolated at 0, 24, 48, and 72h of induction and cDNA was synthesized. Hydroxymethylbilane synthase (HMBS) was selected as housekeeping gene. Expression of genes was quantified by real-time. Relative expression (fold) was calculated by Pfaffl method.

