Submit or Track your Manuscript LOG-IN

Effect and Mechanism of Marein on Diabetic Retinopathy

Effect and Mechanism of Marein on Diabetic Retinopathy

Zhipeng Song1,2, Jialiang Xin1,3, Xiaoli Wei1,2, Abula Zulipiya1,3, Kadier Kedireya1,2 and Xinmin Mao1,3*

1State Key Laboratory of Pathogenesis, Prevention, Treatment of Central Asian High Incidence Diseases, Xinjiang 830001, China
2Department of Pharmacology, Pharmacy College, Xinjiang Medical University, Urumqi, Xinjiang 830011, China
3College of Traditional Chinese Medicine, Xinjiang Medical University, Urumqi, Xinjiang 830011, China
 
* Corresponding author: maoxm_2021@163.com

Fig. 1.
Effect of marein on serum TG, TC, LDL, HDL and BGC in db/db mice.
Note: The values were expressed as `x ± SEM, n ≥ 6, *P < 0.05, **P < 0.01 indicated statistical significance compared with the control group. #P < 0.05, ##P < 0.01 indicated statistical significance compared with the model group.
Fig. 2.
A: HE staining of retina tissue in experimental mice (400×); B: Effect of marein on proliferation and apoptosis of retinal tissue in db/db mice. Note: The values were expressed as `x ± SEM, n ≥ 6, *P < 0.05, **P < 0.01, ***P < 0.001 indicated statistical significance compared with the control group. #P < 0.05, ##P < 0.01, ###P < 0.001 indicated statistical significance compared with the model group.
Fig. 3.

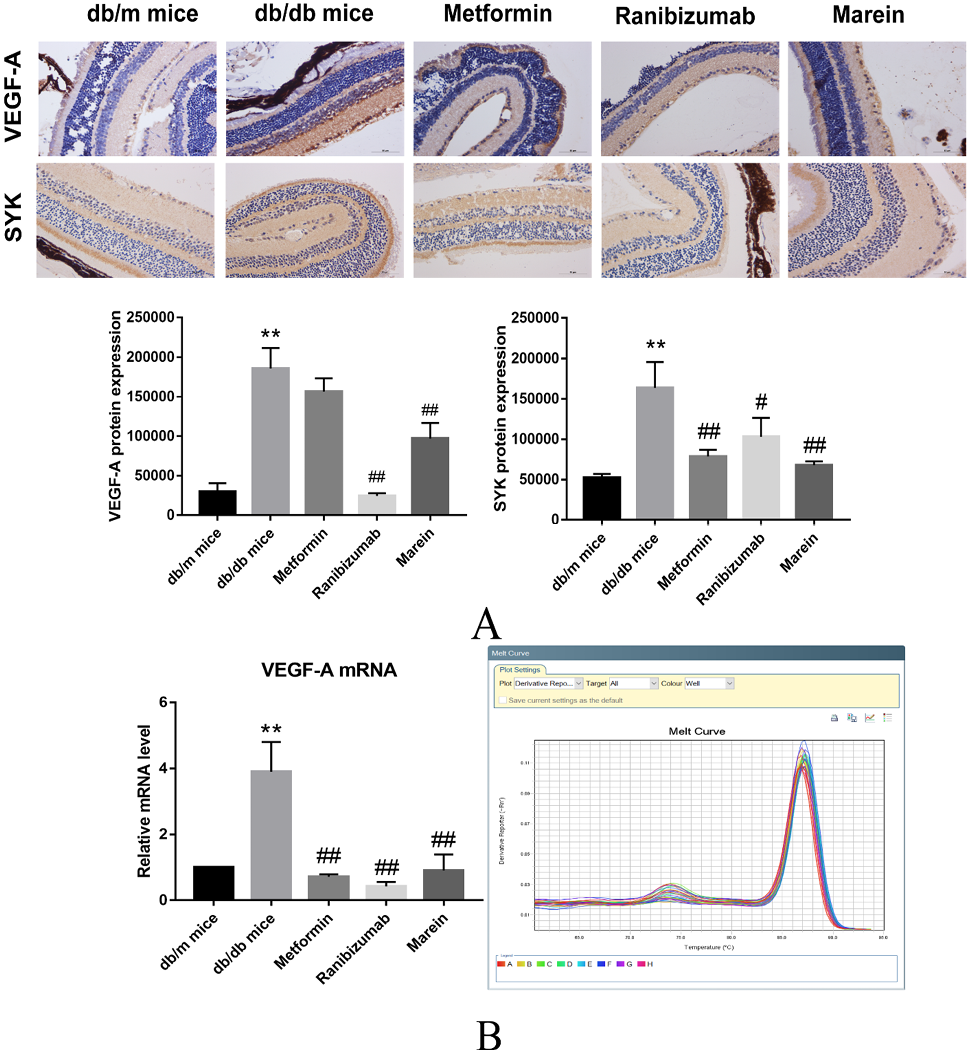
A: Immunohistochemical staining of VEGF-A and SYK in experimental mice retinal tissue (200×). Note: The values were expressed as `x ± SEM, n ≥ 6, *P < 0.05, **P < 0.01 indicated statistical significance compared with the control group. #P < 0.05, ##P < 0.01 indicated statistical significance compared with the model group; B: Effect of Marein on mRNA levels of retinopathy related proteins in retinal tissue of db/db mice. Note: The values were expressed as `x ± SEM, n ≥ 6, *P < 0.05, **P < 0.01 indicated statistical significance compared with the control group. #P < 0.05, ##P < 0.01 indicated statistical significance compared with the model group.

Fig. 4.

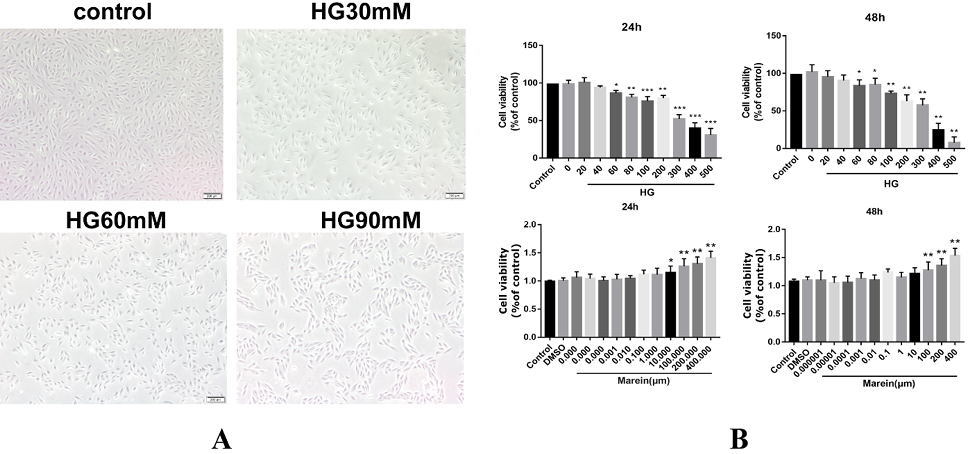
A: Effect of high glucose on cell morphology and quantity. B: Effects of high glucose and marein on cell viability. *P < 0.05, **P < 0.01, ***P < 0.001.

Fig. 5.
Effect of high glucose on protein expression and fibrosis-related parameters in ARPE-19 cells. *P < 0.05, **P < 0.01.
Fig. 6.

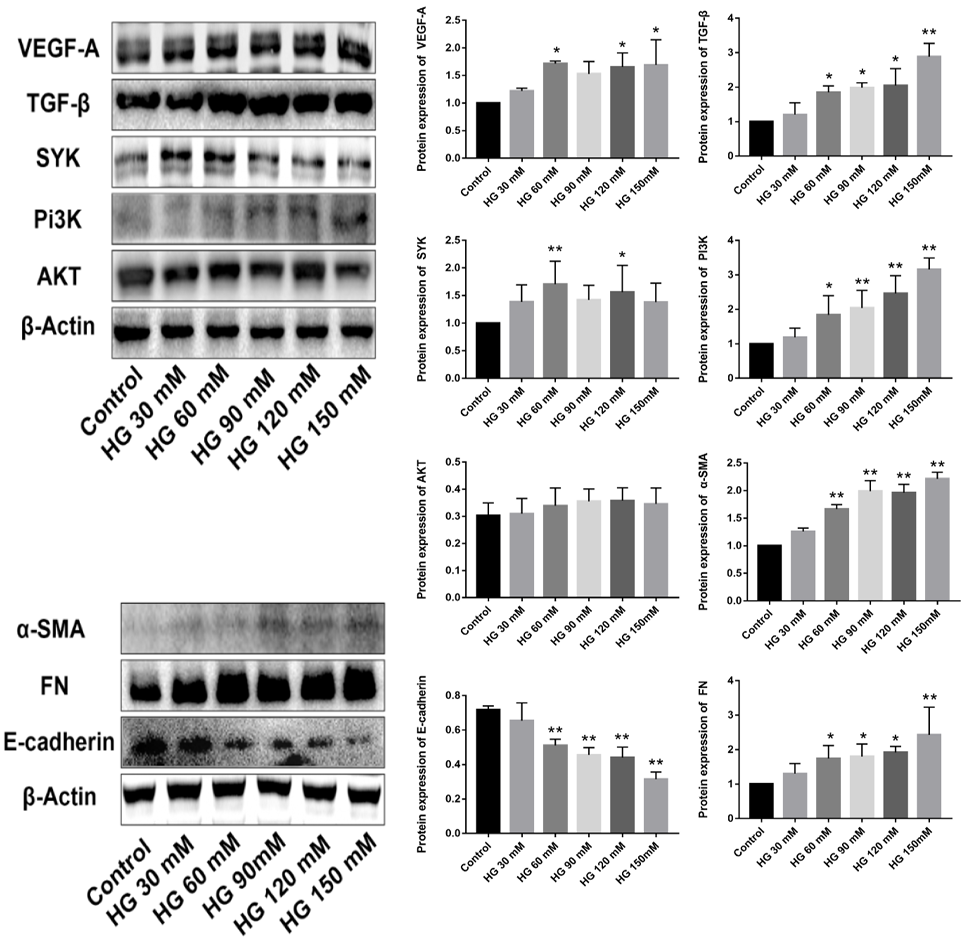
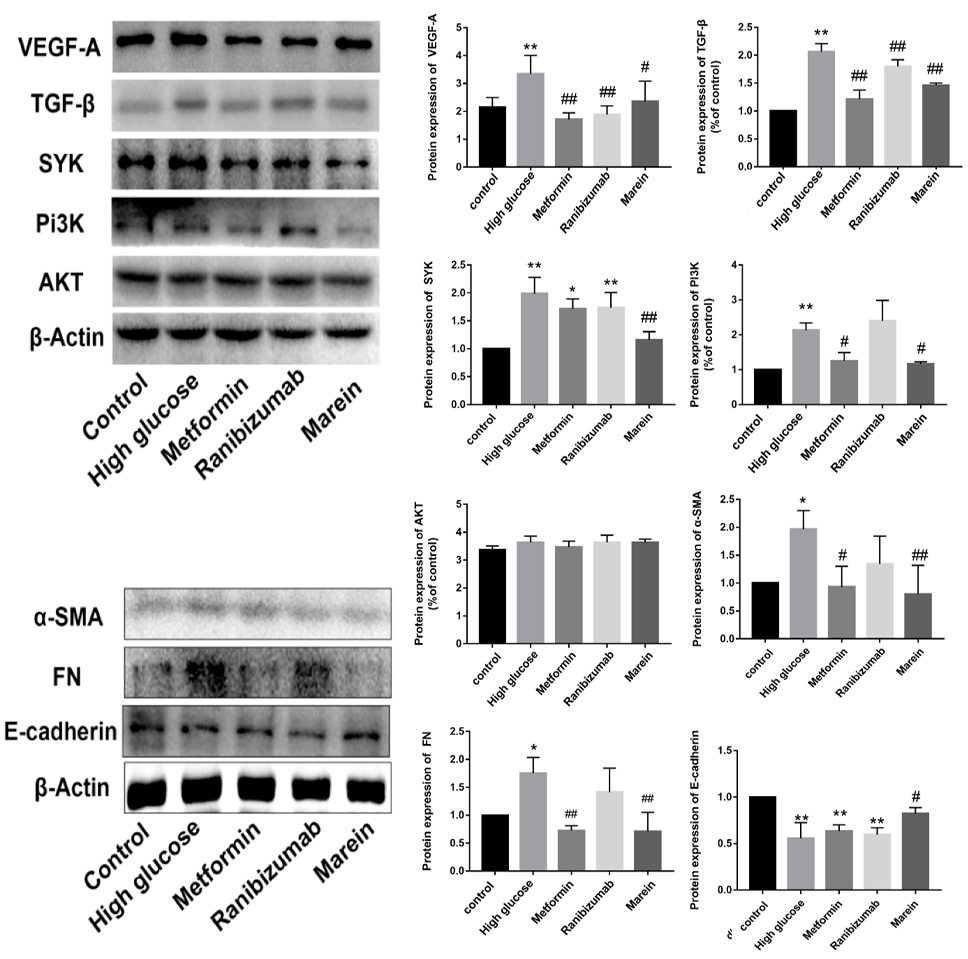
Effect of marein on protein expression in ARPE-19 cells treated with high glucose. Note: *P < 0.05, **P < 0.01 indicated statistical significance compared with the control group. #P < 0.05, ##P < 0.01 indicated statistical significance compared with the model group.

Pakistan Journal of Zoology

April

Pakistan J. Zool., Vol. 56, Iss. 2, pp. 503-1000

Featuring

Click here for more

Subscribe Today

Receive free updates on new articles, opportunities and benefits


Subscribe Unsubscribe