

Effect of DNA Methylation of T Cells on the Development of Experimental Asthma


Effect of DNA Methylation of T Cells on the Development of Experimental Asthma
Xiaoying Liang1,2, Xiaofang Jiang3, Honglin Jia1, Ru Zhang1, Li Gao4* and Qing Yang5*
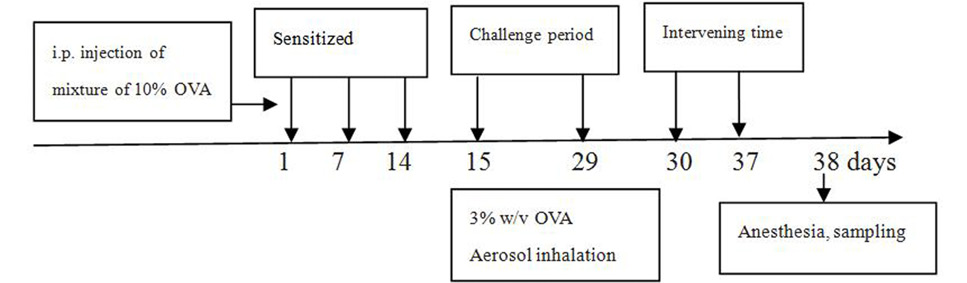
A schematic illustration of the experimental schedule for sensitization and aerosol challenge and drug administration.

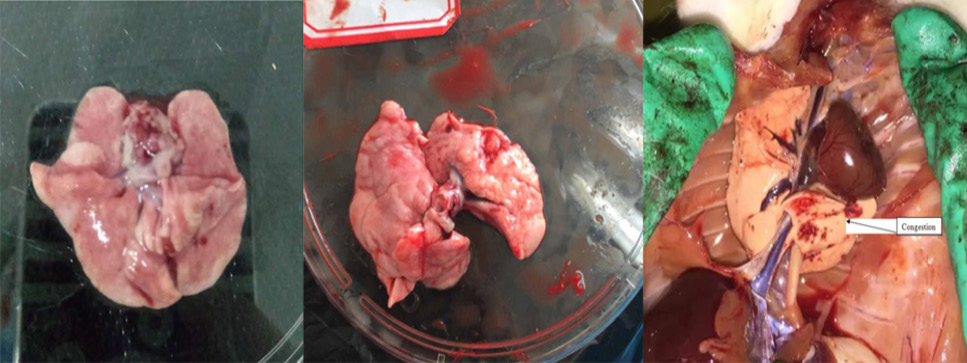
Pulmonary congestion was observed in lung tissue from the constructed asthmatic model rats. Normal lung tissue appears clean and elastic, but the lung tissue of the model group and other groups that were with poor elasticity. (A) Normal lung tissue; (B) Model lung tissue; (C) In vivo lung (5-Aza groups).
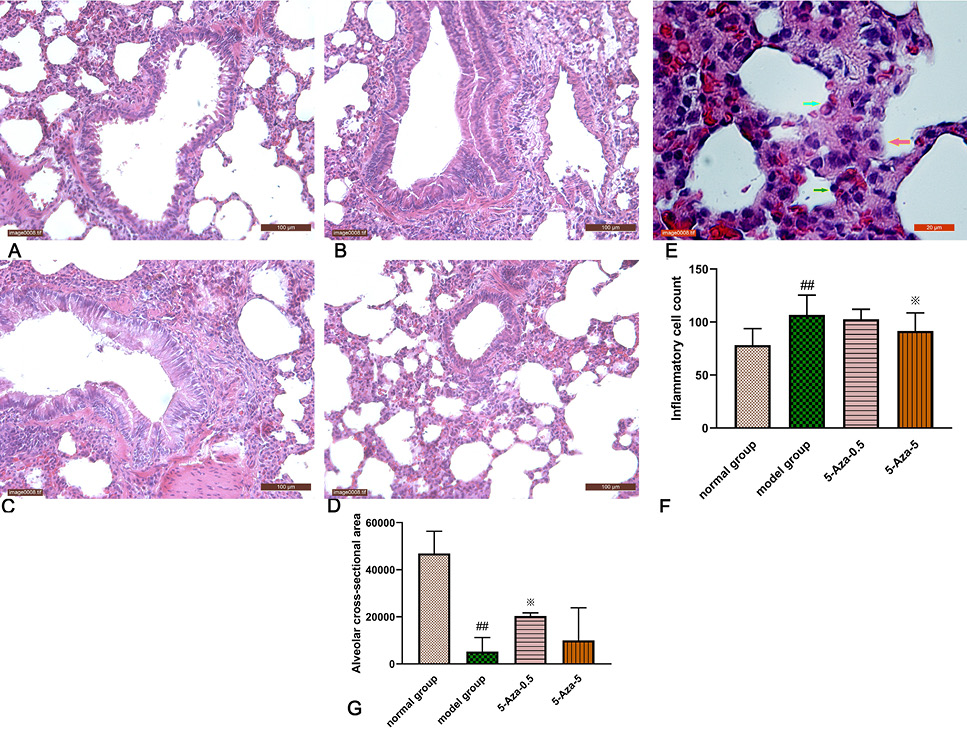
Lung inflammation in lungs in different groups (×10). Compared with the model group, the 5-aza group had less lumen stenosis, mucosal epithelial development and bronchial secretion storage. (A), Normal group; (B), Model group; (C), 5-Aza-0.5 group; (D), 5-Aza-5 group. (E), Graph of inflammatory cell infiltration in HPF of model group. Lymphocytes (green arrows), eosinophils (blue arrows), and monocytes (pink arrows). (F), Statistics of the number of inflammatory cells in HPF. (G), Semiquantitative analysis of alveolar cross-sectional area.

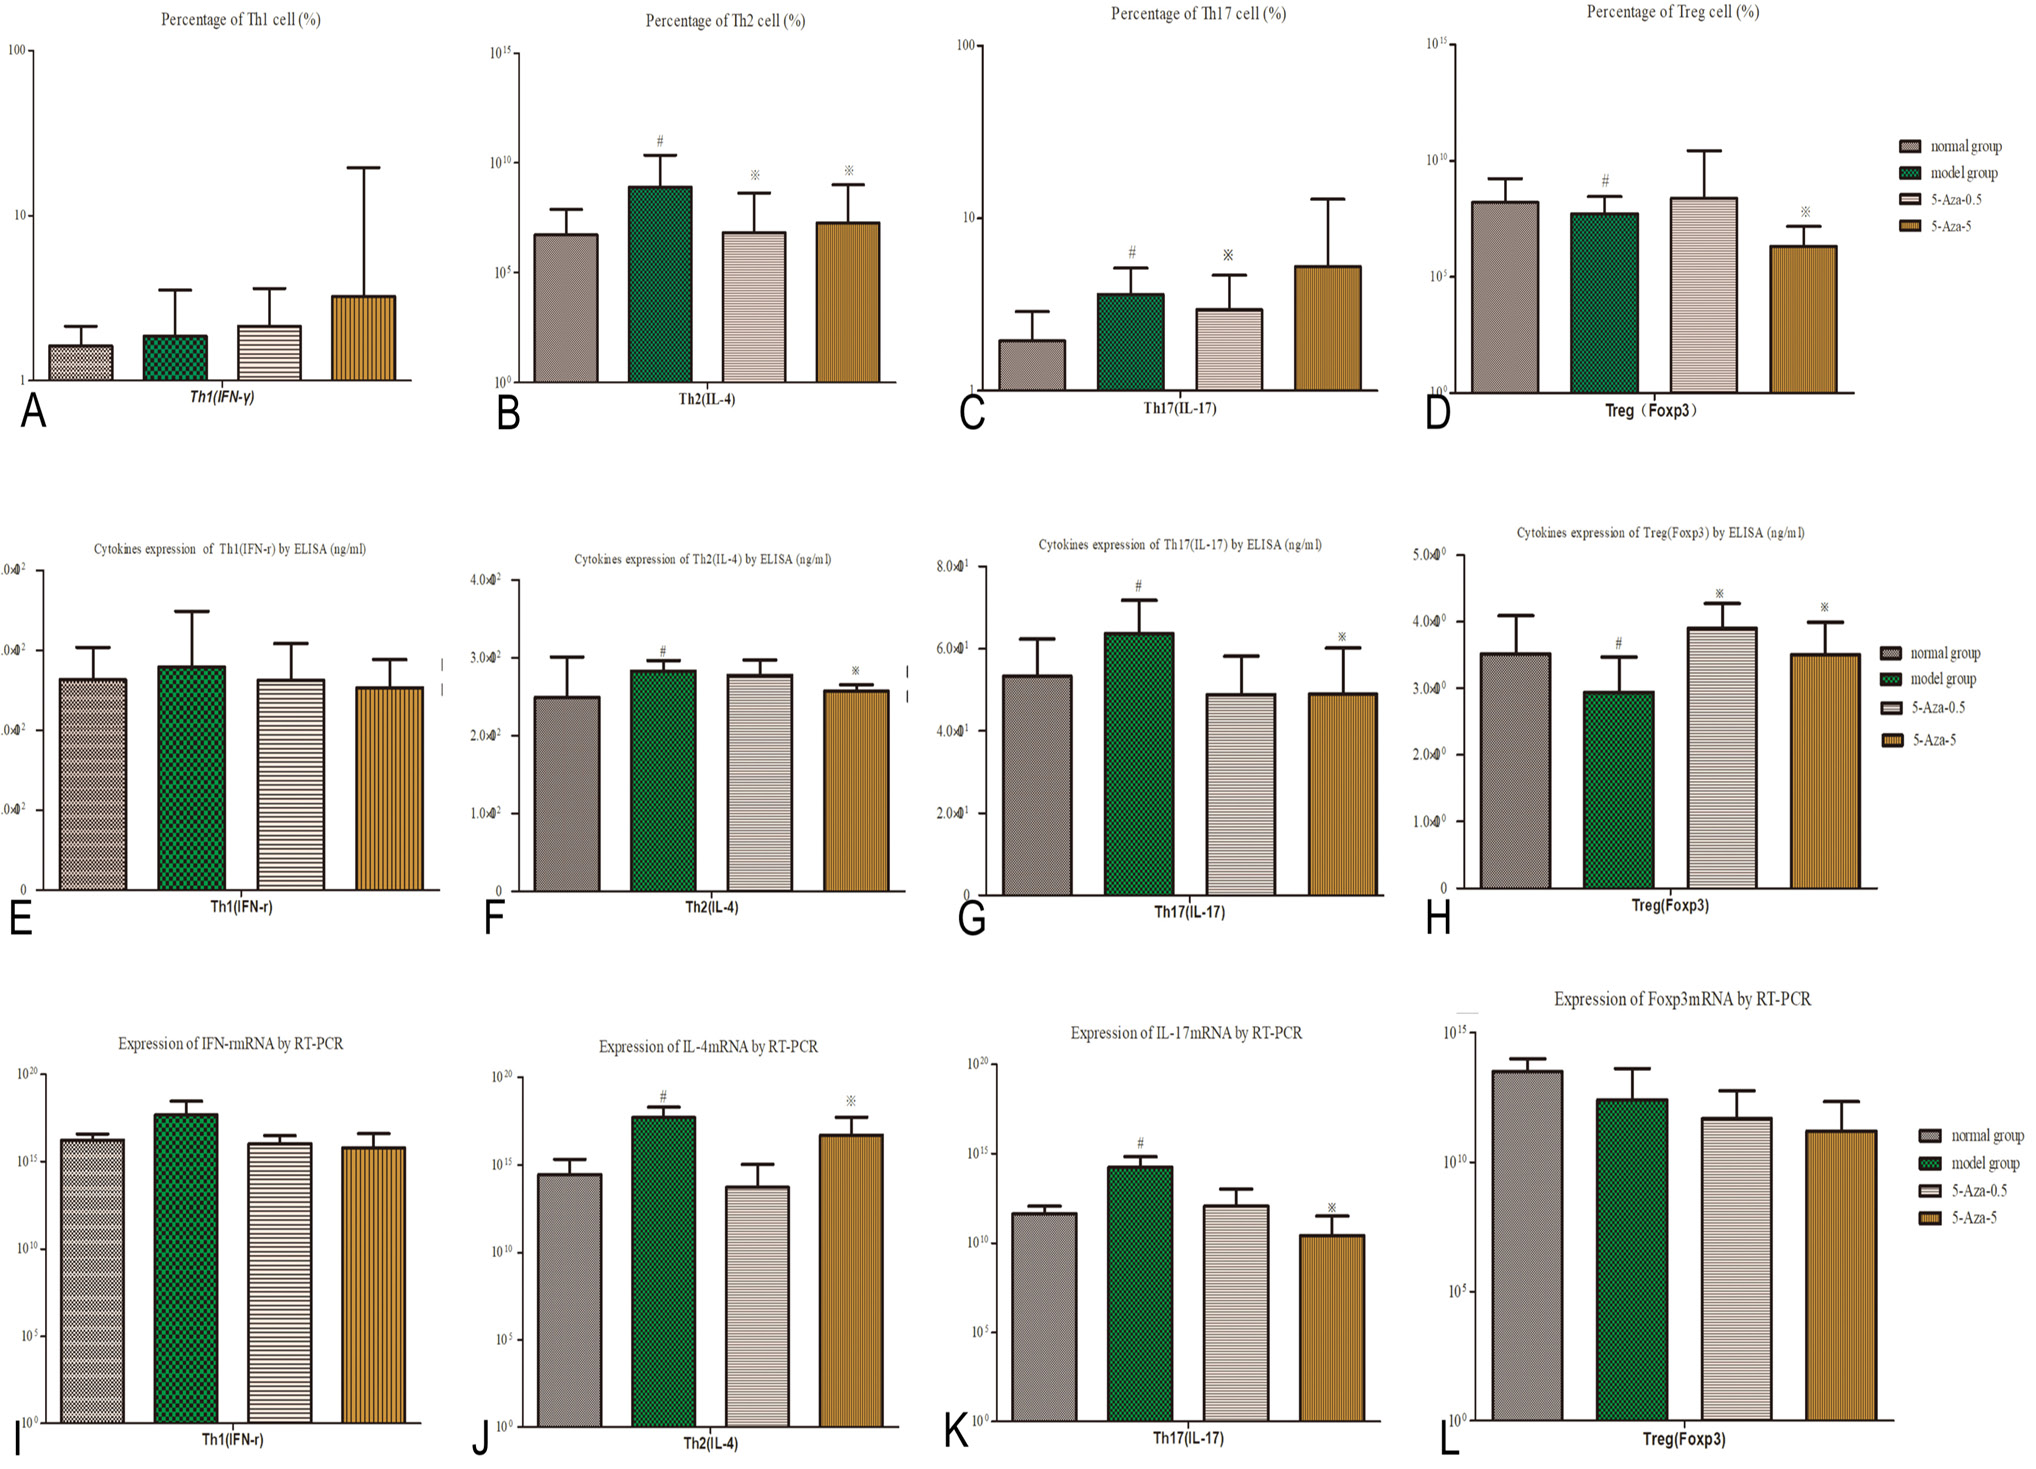
The results of cell counts, cytokine expressions and RT-PCR used for Th1, Th2, Th17, Treg. (A-D) The results of cell counts: The DNMT inhibitor 5-Aza decreased cell counts of Th2, Th17 cells and increased cell counts of Treg cells; (E-H) The results of cytokine expressions: The DNMT inhibitor 5-Aza decreased cytokine expressions of Th2, Th17 cells and increased cytokine expressions of Treg cells; (I-L) The results of RT-PCR: The DNMT inhibitor 5-Aza inhibits transcription levels.The ※ in the figure indicates that there were statistical differences compared with the blank control group.
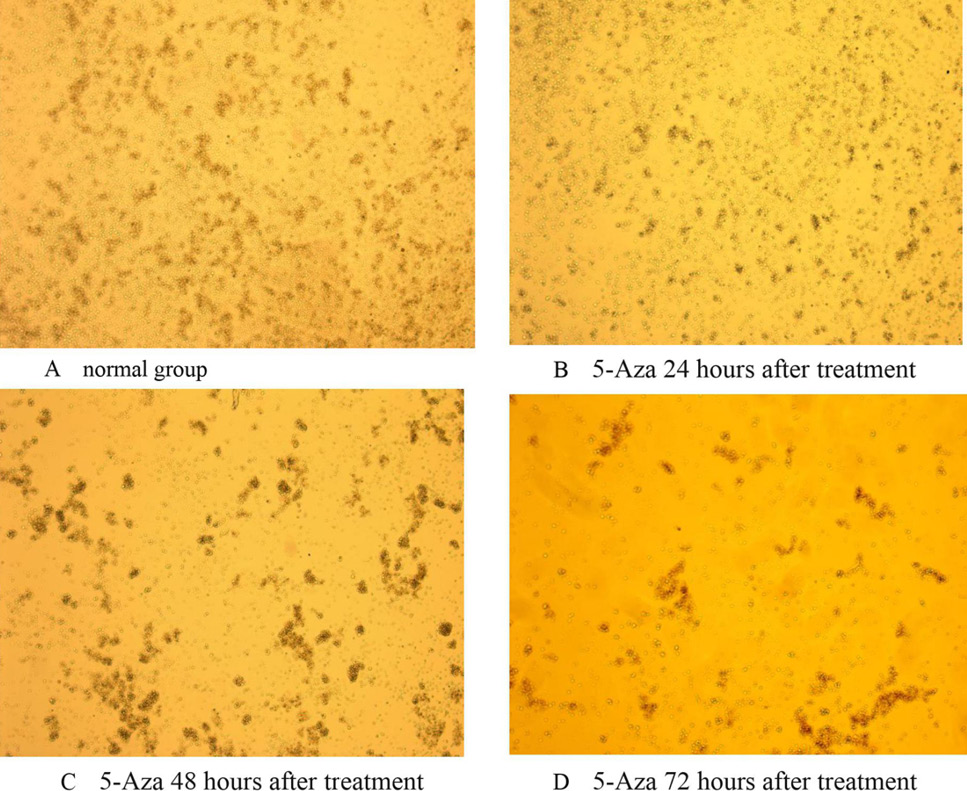
Jurkat T cell morphology at different time periods (10μmol/L concentration). The inhibition of 5-Aza on the proliferation of Jurkat cells had a dose-and time-dependent manner. (A) Normal group; (B). 5-Aza 24 h after treatment; (C). 5-Aza 48 h after treatment; (D). 5-Aza 72 h after treatment.
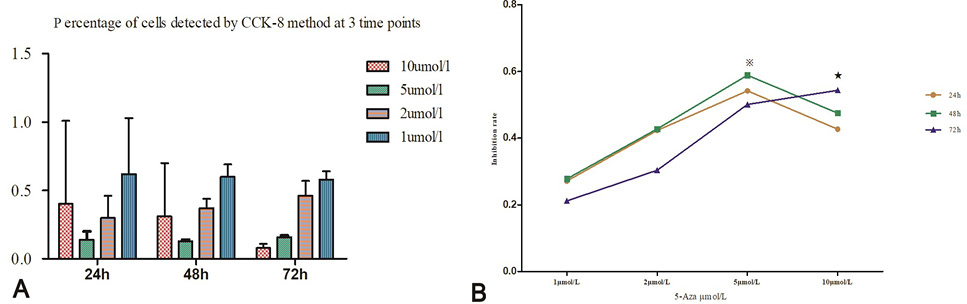
The inhibition rate of Jurkat T cell proliferation. (A), Cell viability at three time points detected by CCK-8. (B), Different concentrations of 5-Aza inhibited Jurkat T lymphocytes and the inhibition rate increased as 5-Aza concentration increased.

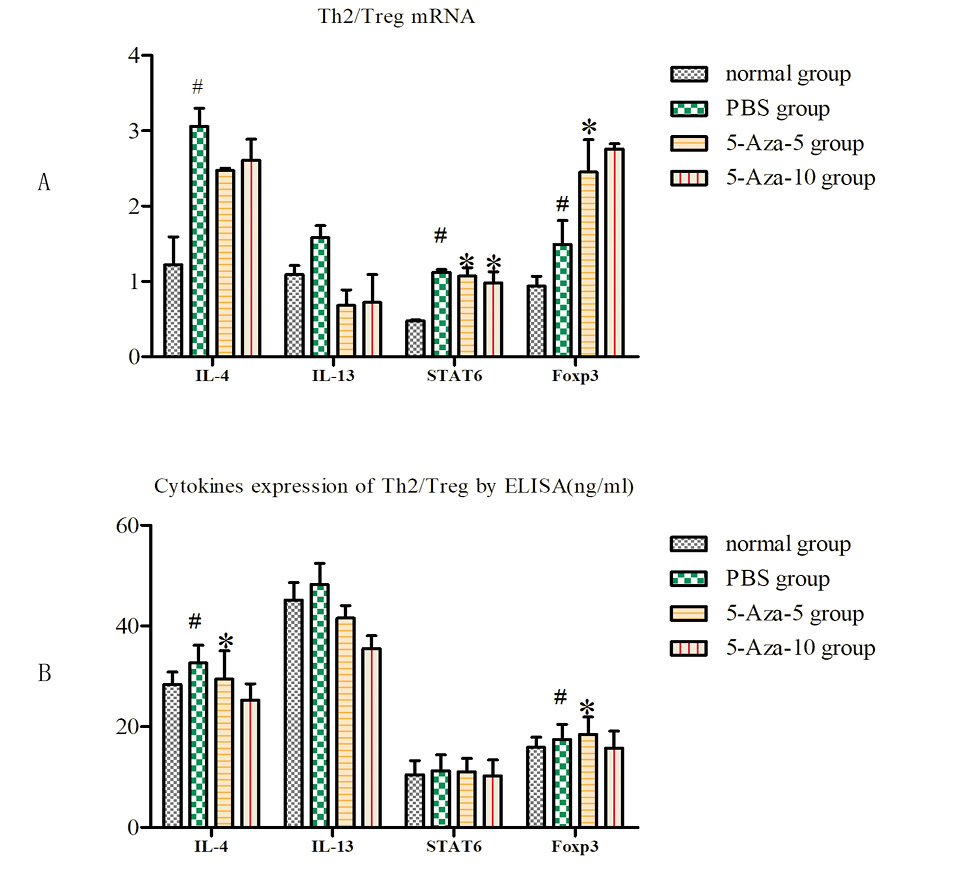
The results of Th2/Treg gene and transcription factor mRNA expression (A) and cytokines protein expression (B): The 5-Aza treatment could down-regulate the mRNA expression and cytokines protein expression of Th2/Treg gene and transcription. Compared to the normal group, #P<0.05. Compared to PBS group, ※P<0.05.

