Research Article
Estimating Food Consumption Patterns in Pakistan by Using Ideal Demand System
Abdul Hameed1*, Ihtsham ul Haq Padda2 and Abdul Salam3
1Federal Urdu University of Arts, Science and Technology, Islamabad, Pakistan; 2Department of Economics, Federal Urdu University of Arts, Science and Technology, Islamabad, Pakistan; 3Department of Economics, Abdul Qadir Memorial Chair, University of the Punjab, Lahore, Pakistan.
Abstract | The purpose of this paper is to examine the behavior of national and regional food consumption and purchasing power to develop food security policies. This study estimates the demand for food in Pakistan through indirect expenditure and price utility functions, using integrated household economic survey 2015-16 data and the nonlinear quadratic almost ideal demand system. The paper finding shows that demand for most commodity items except for fruit, meat, sugar and other products is less than unit elastic to expenditure elasticity at the country and regional levels. Cross price elasticity assessment demonstrates that the most nutritious food items, such as fruit, milk and meat, are complementary products as compared to wheat, pulse and vegetables in Pakistan as well as urban and rural areas. The regional analysis indicates that the gross and net substitute impacts in urban areas are somewhat more dominant than in rural areas. It implies that urban areas household makes more substitutes relative to rural areas. These findings suggest that policy makers and public organizations should reexamine the connection between consumption, price and income for food and nutrition security and social development. It also proposes that constant price of nutritious food and any rise in prices of these commodities should be supported by price subsidization or safety nets programmes for deprived groups. In addition, the state should concentrate on rural income generation activities such as agriculture, livestock and its related industries.
Received | December 12, 2019; Accepted | November 30, 2020; Published | February 06, 2021
*Correspondence | Abdul Hameed, Federal Urdu University of Arts, Science and Technology, Islamabad, Pakistan; Email: hameedleghari@gmail.com
Citation | Hameed, A., I.H. Padda and A. Salam. 2021. Estimating food consumption patterns in Pakistan by using almost ideal demand system. Sarhad Journal of Agriculture, 37(1): 92-103.
DOI | http://dx.doi.org/10.17582/journal.sja/2021/37.1.92.103
Keywords | Consumer behavior, Almost-ideal demand system, Food demand elasticities, Food demand
Introduction
Food is an essential component of our daily requirements for active and healthy lives. It provides us energy for good growth and for the development of our body. As stated in Article 25 of the Universal Declaration of Human Rights: “Everyone has the right to a standard of living that is adequate for the health and well-being of himself and his family, including food, clothing, housing and medical care” (Jones et al., 2013). Food and nutrition deficiencies lead to poor health and low productivity with high medical cost. For children under the age of five, these lacks prompt to stunting and wasting. In addition, stunting and wasting increase the likelihood of chronic diseases, decrease the cognitive ability of school going children and decrease their lifetime income (World Bank, 2006).
The majority of the undernourished people (780 out of 795 million) belong to developing countries (FAO, 2015). Pakistan is one of them with nearly 68% households in the country consuming less than the required calorie intake per day per adult equivalent. The provincial level finding shows that Punjab is the most populous region in the country, has 52.9% children under the age of 5 recorded undernourished, 34% suffering from stunting, and 37% of households consume less than the required calorie intake per day per adult equivalent. In Sindh, 48% of children are stunted and 51% of households consume less than the required calorie intake per day per adult equivalent. In Khyber Pakhtunkhwa, 42% children under five years are confronted with stunting and 49% households live on less than per capita daily requirements of 2350 calories (Spielman et al., 2016). The nutritional situation in Balochistan is reported to be the worst of all the provinces in Pakistan as 71% children are reported to suffer from multidimensional poverty in nutrition, health, education, child development, housing and sanitation (Hameed and Padda, 2017).
Agriculture is an imperative sector for basic food requirements in Pakistan, where wheat, rice and pulses are the primary source of food for the growing population (WFP, 2016). The other most important sub-sector of agriculture is livestock and poultry where 8 million households/families are involved and earn more than 35% of their income from the livestock activities (GoP, 2017).
The literature depicts that agriculture sector is crucial for rural development and poverty reduction (Spielman et al., 2016). The majority of poor households depend on agriculture sector for the food acquisition and cash income. According to recent consumption analysis, poor households spend more on basic food (wheat, oil and sugar) as compared to non-poor households. The portion of the wheat calorie intake of non-poor and poor is 43% and 52%, respectively (Malik et al., 2014).
This study estimates the demand for food in Pakistan through the almost ideal demand system in order to understand the behavior of household consumption and the purchasing power of food at national and regional levels to enhance the better food security policies. For policy makers, food security experts and academia, the importance of this study provides comprehensive, up to date literature on food demand patterns in Pakistan. The objective of this study is to construct a strong evaluation of demand analysis to help in the development of decentralized policies. In addition, these decentralized findings will be used to create strategies at a local and national level to assist communities, marginalized individuals, 41.4 million undernourished and 38.8% multidimensionally deprived Pakistanis.
Materials and Methods
The research utilizes data from the Pakistan Living Standard Household Integrated Income and Consumption Survey (HIICS) 2015-16 undertaken by the Pakistan Bureau of Statistics (PBS). This is the most latest and available information set on food and non-food consumption expenditure and includes both the urban and rural areas of Punjab, Sindh, KP and Balochistan. Table 1 shows the province’s accurate sample distribution and shows that 43.4% of the sample is from Punjab, 25.5% from Sindh, 21.5 percent from KP and 9.7% from Balochistan. This paper uses 23052 household data for this study and 1186 households has been excluded owing to lack of information.
Table 1: Covered number of households during 2015-16.
|
Province |
Rural |
Urban |
Overall % |
Total |
|
Punjab |
3,327 |
7,181 |
43.4 |
10,508 |
|
Sindh |
2,264 |
3,912 |
25.5 |
6,176 |
|
KP |
1,887 |
3,322 |
21.5 |
5,209 |
|
Balochistan |
605 |
1,740 |
9.7 |
2,345 |
|
Total |
8,083 |
16,155 |
100.0 |
24,238 |
Source: Pakistan Bureau of Statistics, 2015-16.
This research measures the responsiveness of the food demand of 11 food groups, including wheat, rice, other cereals, pulses, fruit, vegetables, dairy, meat, oils and fats, sugars and others, which offer a great deal to estimate consumption patterns, preferences and decision making. According to the empirical literature on food demand assessment, there is no economic theory or technique accessible to provide an official guideline for the structure of food groups (Suharno, 2002). This study uses previous research literature (Malik et al., 2014), (Haider and Zaidi, 2017) and (Ullah and Jan, 2016) and nutritional substances to create food groups and compares the own and cross price elasticities of the above described food groups using the Quadratic Almost Ideal Demand System (QUAIDS) models of Banks et al. (1997) based on the standard Deaton and Muellbauer (1980) and Mas-Colell et al. (1995) models.
This technique based on the indirect utility function and modified QUAIDS model uses share of food expenditure and reported price of the quantity (proxy of retail price) with household characteristics, for example, socioeconomic, demographic, provincial and regional variables which is consolidated by Ray’s (1983). This study uses the implied price for each food item not actually representing the marginal price faced by the customer (Suharno, 2002; Blundel et al., 1993) and calculates the weighted price for each food product bundle as:
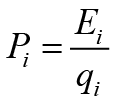
Where;
Pi is the implicit price of each food item, Ei is the total expenditure on each food item and qi is the total quantity of each food item that paid and consumed by the consumer. Furthermore, weighted price for each food group is calculated as:
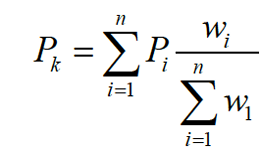
Where;
Pk is the price of food groups and wi is the share of food items in their respective food category or group.
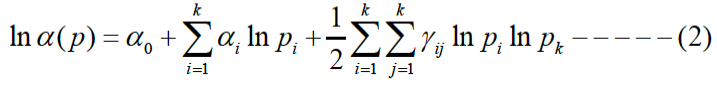
During the most recent couple of decades, this framework has been broadly used in many empirical works on demand studies (Wadud, 2006). There are several studies from developed and developing countries have used an AIDS system to estimate demand behavior, for example, Aziz et al. (2011), Blanciforti and Green (1983), Cashin (1991), Chambers and Nowman (1997), Dybczak et al. (2010), Haider and Zaidi (2017), Holt and Goodwin (2009), John et al. (2003), Obayelu et al. (2009), Poi (2012), Raknerud et al. (2007), Ramíreza (2013), Suharno (2002), Thompson (2004), Tiffin and Arnoult (2010), Ullah and Jan (2016), Wadud (2006) and Zhou (2015). The quadratic indirect utility function is as:
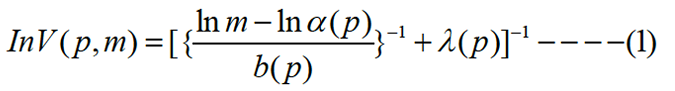
Where;
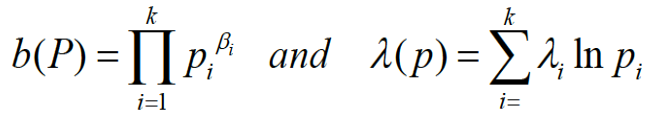
Lnα (p) is the price index function and further calculates as:
Where;
Pi is the price of the commodity food bundle i for i=1, …k and b(P) is the Cobb-Douglas price aggregator as;
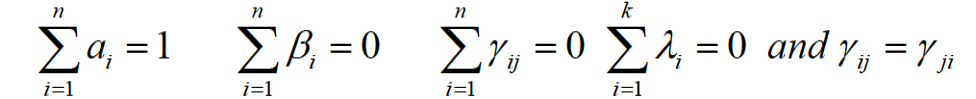
Adding up the homogeneity and symmetry assumption as:
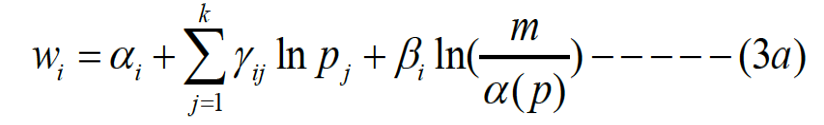
After applying the Ray’s identities on Equation 1, expenditure share function obtains as:
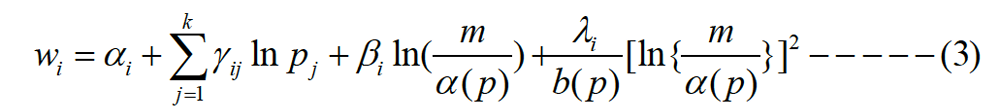
Where;
wi is expenditure share associated with wheat, rice, other cereals, pulses, fruits, vegetables, dairy, meats, oils and fats, sugars and others as wi= pi qi/ m, qi is quantity demand of commodity food bundle and m is total expenditure of commodity food bundle and, αi , γij and βi constant and parameters for giving food groups, pi is the price of the previously mentioned food groups from data set which is a closed proxy of the retail price of food items. If λi = 0 for all commodity food bundle, then Equation 3 converted into Deaton and Muellbauer’s (1980a) original AIDS model as:
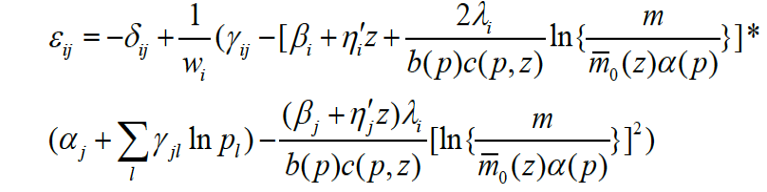
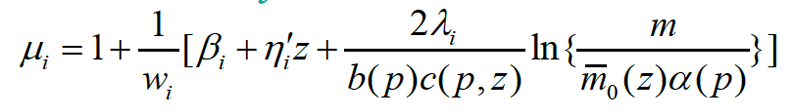
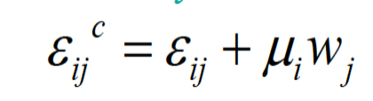
For the quadratic AIDS model with demographic variables, uncompensated, expenditure and compensated price elasticities are calculated as:
Uncompensated price elasticity
Expenditure elasticity
Compensated price elasticity
Results and Discussion
This paper uses the QUAIDS model. Demographic control factors such as family size, poverty status and national (urban / rural) areas are also included according to the guidance of Ray’s (1983) literature. The per capita demand elasticity is predicted at national and domestic concentrations using a maximum likelihood approach suggested by Poi (2002, 2008).
The estimated results of the 11 food groups with demographic variables indicates that the parameters αs , βs, γs and λs of the national and regional regressions are statistically significant at 1%.
In particular, Lambdas (λs) parameters in national and regional level models that control the effect of second order coefficient on budget shares are statistically significant for most of 11 food groups; this confirms the relevance of the quadratic term extension of the linear AIDS. The quadratic term in the logarithm of expenditure is close to zero only in the case of oil and fats in national and rural regressions, oil and fats and sugars in urban regression. This research focuses on expenditure and price elasticity rather than regression coefficients. In addition, the outcomes of expenditure and price elasticity are provided in two parts below.
Expenditure elasticity
Expenditure elasticity considered a substitute for the elasticity of income. Income elasticity measures the demand responsiveness of the previously stated 11 food commodity groups. It indicates that how the quantity demands of food commodities change with change in consumer expenditure. Based on the outcomes of the expenditure elasticity, commodity food such as wheat (0.30), rice (0.29), pulse (0.32), fruit (0.20), milk (0.06) and oil and fat (0.63) are normal and essential commodities. While, fruit (3.82), meat (3.82), cheese (1.11) and other (1.45) commodities are luxury and other cereals (-0.12) are inferior in the year 2015-16 in Pakistan and as well as poor, non-poor and large household size, respectively. This means that households in Pakistan are faced with tight budgetary constraints vis-à-vis their respective food groups. These results are consistent with Haider and Zaidi (2017), and Ullah and Jan (2016).
Table 2: Expenditure elasticity.
|
|
Pakistan |
|||
|
Poor |
Non-Poor |
HH Size>4 |
Overall |
|
|
Wheat |
0.42 |
0.21 |
0.32 |
0.30 |
|
Rice |
0.35 |
0.26 |
0.31 |
0.29 |
|
Other Cereals |
-0.03 |
-0.18 |
-0.12 |
-0.12 |
|
Pulses |
0.40 |
0.27 |
0.33 |
0.32 |
|
Fruits |
4.93 |
3.51 |
3.90 |
3.82 |
|
Vegetables |
0.29 |
0.15 |
0.21 |
0.20 |
|
Dairy |
0.06 |
0.06 |
0.05 |
0.06 |
|
Meats |
4.39 |
3.62 |
3.83 |
3.82 |
|
Oils and Fats |
0.69 |
0.61 |
0.64 |
0.63 |
|
Sugars |
1.06 |
1.14 |
1.11 |
1.11 |
|
Others |
1.50 |
1.44 |
1.47 |
1.45 |
|
|
Urban areas |
|||
|
Wheat |
0.30 |
0.07 |
0.20 |
0.17 |
|
Rice |
0.70 |
0.66 |
0.68 |
0.67 |
|
Other Cereals |
0.02 |
-0.20 |
-0.11 |
-0.12 |
|
Pulses |
0.00 |
-0.10 |
-0.04 |
-0.07 |
|
Fruits |
4.58 |
3.23 |
3.61 |
3.53 |
|
Vegetables |
0.12 |
0.01 |
0.05 |
0.05 |
|
Dairy |
0.30 |
0.28 |
0.28 |
0.29 |
|
Meats |
4.69 |
3.81 |
4.06 |
4.04 |
|
Oils and Fats |
0.63 |
0.58 |
0.60 |
0.60 |
|
Sugars |
0.80 |
0.80 |
0.80 |
0.80 |
|
Others |
1.29 |
1.24 |
1.26 |
1.25 |
|
|
Rural areas |
|||
|
Wheat |
0.73 |
0.65 |
0.69 |
0.68 |
|
Rice |
-0.81 |
-1.03 |
-0.91 |
-0.96 |
|
Other Cereals |
1.46 |
1.67 |
1.57 |
1.59 |
|
Pulses |
0.14 |
0.02 |
0.09 |
0.06 |
|
Fruits |
2.75 |
2.04 |
2.24 |
2.20 |
|
Vegetables |
0.31 |
0.19 |
0.24 |
0.24 |
|
Dairy |
0.44 |
0.48 |
0.46 |
0.47 |
|
Meats |
3.43 |
2.82 |
2.99 |
2.98 |
|
Oils and Fats |
0.61 |
0.53 |
0.57 |
0.56 |
|
Sugars |
1.83 |
2.02 |
1.94 |
1.96 |
|
Others |
1.39 |
1.33 |
1.35 |
1.35 |
|
Normal food |
Luxury food |
Inferior food |
||
Expenditure elasticity results show that poor and large family households face tight budgetary constraints compared to non-poor and small family households in Pakistan, with the exception of dairy and sugar products (see Table 2). This ensures that the demand for food is more vulnerable to small changes in spending for poor households. Regional numbers indicate that commodity food bundles, such as other cereals (-0.012) and pulses (-0.07) are inferior products in urban areas. Fruit (3.53) and meat (4.04) are also luxurious for urban poor households. Urban poor households are also vulnerable in the nourishing food. The findings of the rural areas show that rice (-0.96) is inferior and other cereals (1.59), fruit (2.20), meat (2.98), sugar (1.96) and others food commodities (1.35) are luxuries. One possible explanation is that the majority of households in rural areas are used IRRI (Non-Basmati) rice, which costs from Rs.35 to Rs.60 opposed to urban areas where households are used Basmati rice, which costs from Rs.90 to Rs.200. The demand of dairy commodity food bundle in non-poor households is more elastic as compared to poor households in rural areas. Comparing poor and non-poor households in urban and rural areas, the poorest households are more sensitive or more responsive demand to change in expenditure (income) in both urban and rural areas. These results are consistent with previous research Haider and Zaidi (2017), and Ullah and Jan (2016).
Price elasticity
Price elasticity is divided into own and cross price elasticities. Moreover, own and cross price elasticities presented into uncompensated (Marshellian) as well as compensated (Hicksian) price elasticities. Uncompensated price elasticity indicates how the quantity of commodity food bundle demand changes to price changes and consumer income remains constant and compensated price elasticity indicates the substitution effect. It means that with a price change consumer receive a compensation that allow sthem to keep their original consumption level as before the price change.
Own price elasticity
Table 3 presents its own price elasticity for uncompensated and compensated demand. It shows that the commodity food bundles have a negative elasticity sign, according to economic theory, that the quantity of commodity food bundles is to be reduced when the price of the food is to be increased.
Table 3: Own price elasticity (uncompensated and compensated).
The uncompensated own price elasticity of rice (-0.82), other cereals (-0.93), fruit (-0.80), vegetables (-0.76), meats (-1.19) and others product (-1.07) varies from less than to more than 1. The uncompensated own price elasticity of poor households and households with more than 4 household members is more sensitive than non-poor households because the absolute value of the uncompensated price elasticity of poor households is higher than that of non-poor households in Pakistan and urban and rural areas. The uncompensated own price elasticity of wheat, pulses, dairy, oil and fat, and sugar commodity food bundles is more inelastic across Pakistan.
Compensated own price elasticity shows how the demand of commodity food bundles influenced by the prices in the lack of any compensation. Commodity food bundles of rice (-0.81), other cereals (-0.94), fruit (-0.60), vegetables (-0.74), meat (-0.72) and others (-0.94) are more delicate throughout Pakistan. The contrast between uncompensated and compensated own price elasticity shows that uncompensated own price elasticity more sensitive than compensated own price elasticity. It shows that all commodity food bundles are normal foods in price elasticity of their own.
The regional level assessment demonstrates that the demand for most commodity food bundles are price inelastic (with the exception of ‘other cereals’ in rural regions). These findings are consistent with the Malik et al. (2014) research. In the urban region, the demand for commodity food bundles of wheat, vegetables, oils and fats, and for sugars own price elasticities are less than 0.70 before they can be compensated. Conversely, the demand for commodity food bundles of wheat, vegetables, fruit, dairy, oils and fats, sugars own price elasticity is less than 0.70 before it can be compensated in rural regions. The absolute price elasticity value of wheat for poor and large households size is slightly more than non-poor and overall as well as urban and rural areas.
Cross price elasticity
Cross price elasticity describes the relationship between two commodity food bundles, i.e. whether the commodity food bundles are complementary or substitutes for each other. It is observed that two commodity food bundles are complementary to each other if cross price elasticity is negative and substitute for each other if cross price elasticity is positive. Normally cross price elasticity indicates how the quantity demand of the commodity food bundle changes with changes in the price of the other commodity food bundle.
Table 4 reveals cross price elasticity with a national matrix of uncompensated price elasticity. The uncompensated cross-price elasticity matrix depicts the gross effect, including both substitution and income. The matrix of compensating cross price elasticity shows the only effect of price changes on substitution or net effect. The findings indicate that of the 110 pairs of cross price elasticity matrix, only 42 are positive signs (gross substitute foods) before allowing for income adjustment (uncompensated), and the remaining 68 pairs are negative signs (gross complementary foods). Only 74 net substitute commodity food bundles change and the other 36 remain fixed, complementary commodity food bundles after permitting income adjustment, in order to maintain the utilities constant at the previous level of the 110-pair cross-price elasticity matrix.These findings show that, when the price of the commodity food bundle rises, it is balanced by an adjustment of income in order to preserve the initial level of utility. Households make substitutions between commodity food bundles in Pakistan because the number of substitutes in the compensated cross price elasticity matrix is higher than the uncompensated cross price elasticity matrix.
Wheat and rice have positive cross price elasticity (uncompensated and compensated) in both instances. It implies that a 1% change (increase) in the price of wheat the demand for rice to be reduced by 0.095%. Similarly, a 1% change (increase) in the price of rice the demand for wheat to be reduced by 0.051% in the case of gross substitute. But after enabling the income adjustment, a 1% shift (increase) in the price of wheat would increase the demand for rice by 0.14% and the same 1% shift (increase) in the price of rice would increase the demand for wheat by 0.062%. These numbers suggest that rice is more likely substitute of wheat and wheat is less likely substitute of rice when the price of wheat and rice change. These results are consistent with Haider and Zaidi (2017).
The absolute value of the cross price elasticity in both cases (uncompensated and compensated) indicates the lower value of the cross price elasticity described in that diet in Pakistan is based on a single commodity food bundle with small amounts of other commodity food bundles and a lack of dietary diversity.
Table 4: Cross price elasticity in Pakistan.
The most nutritious food, such as fruit, dairy and meat are complementary foods to wheat, pulses and vegetables throughout Pakistan. The increase in the price of wheat, pulses and vegetables reduce the demand of nutritious food before adjusting the expenditure (income) to compensate for the price, and after adjusting the household expenditure (income) at the same utility level, households make more substitutions between nutritious complementary foods. Regional level analysis shows the 110 combinations of the cross price elasticity matrix, 47 combinations have positive signs (gross substitute foods) before allowing expenditure (income) adjustment (uncompensated) and the remaining 63 combinations of the cross price elasticity matrix have negative signs (gross complement foods) in urban areas. After adjusting household expenditure (income) to maintain the same amount of utility in urban areas (Table 5).
The findings from rural regions reveal that of the 110 combinations of the cross price elasticity matrix, 66 combinations of the cross price elasticity matrix became net substitute commodity food bundles and the remaining 42 combinations of the cross price elasticity matrix became net complementary food bundles and 2 reveal no connection. Conversely, out of 110 pairs of cross price elasticity matrix, 32 pairs have positive signs (gross substitute foods) before enabling income adjustment (gross substitute foods) and the remaining 78 pairs have negative signs (gross complement foods) in rural regions (Table 6).
Table 5: Cross price elasticity in urban areas.
After the adjusting of household expenditure with income to keep the utility level same in rural areas, the results show that out of 110 combinations, 72 combinations are substitute commodity food bundles and remaining 38 combinations are net complement commodity food bundles (Table 6).
These findings also indicate that the gross and net substitutive effects in urban regions are more dominant than in rural regions. This implies that urban regions of households make more substitutes relative to rural regions. This suggests that urban households have adopted commodity food bundle diversification when the price of the commodity rises or falls. It may be urban households are more advanced in household budgeting management relative to rural households.
Stimulating results in rural regions are that, after adjusting household expenditure to maintain the utility level unchanged, wheat and rice do not substitute each other. In the case of wheat, after adjusting expenditure, other cereals, pulses, fruit and meat are net substitutes for wheat consumption. Conversely, in the case of rice-fruit, meat, sugar and other commodity food bundles became net substitutes. This behavior suggests that the diversification of the commodity food bundles can be accomplished through income compensation in rural households (Table 5 and 6).
Table 6: Cross price elasticity in rural areas.
Conclusions and Recommendations
This study analyzed consumption patterns at national and regional levels, along with additionally poor, non-poor and households with more than 4 members, using data from HIES 2015-16 using the QUAIDS. The consumption patterns have been established by the use of the expenditure and price elasticity of 11 commodity food bundles.
The demand analysis demonstrates that demand for most commodity food bundles excluding fruits, meats, sugar and others in Pakistan (at the country and a regional level) is less than unit elastic to expenditure elasticity. According to economic theory, all commodity food bundles have a negative elasticity sign and implying that the quantity of commodity food bundles is reduced when own prices are increased, followed by poor, non-poor and large household sizes. The uncompensated own price elasticity of rice, other cereals, fruit, vegetables, meat and other staple food bundles varies from less than unity and more across the Pakistan. However, poor and large households are more sensitive than non-poor households in the light of the fact that the absolute value of uncompensated household price elasticity of poor households is marginally higher compared to non-poor households across Pakistan (see Table 3).
Cross price elasticity results show that households make substitutions between commodity food bundles in Pakistan because the number of substitutes is higher in compensated cross price elasticity matrix when contrasted with uncompensated cross price elasticity matrix. Wheat and rice have positive cross price elasticities in both cases (uncompensated and compensated) and the results show that rice is more likely substitute of wheat and wheat is less likely substitute of rice when the price of wheat and rice change.
In addition, the absolute values of cross price elasticity in both cases (uncompensated and compensated) suggest a lower value of cross price elasticity depicting the diet in Pakistan relies on a single commodity food bundle with small amounts of other food bundles and a lack of dietary variety. The most nutritious food bundles, such as fruit, milk and meat, are complementary items to wheat, pulses and vegetables in Pakistan. A marginal increase in the price of wheat, pulses and vegetables reduce the demand for nutritious foods. The regional analysis shows that gross and net substitute impact in urban areas is somewhat more dominant than rural areas. It implies that urban areas household makes more substitutes between commodity food bundles as compared to rural areas.
According to the demand analysis, this paper has important policy implications as well;
- The price of more versatile commodity food bundles, such as fruit, meat, sugar and others, should be kept constant, particularly for poor households by providing support prices. In addition, demand of nutritious foods such as fruits, dairy and meats is more sensitive. The imposition of any tax or increase in price on these commodity food bundles can result in enormous decrease in the consumption of these commodities.
- Cross-price elasticity results indicate that Pakistan is facing a high price of commodity food bundles. This suggests that policy makers and government institutions must re-examine the relationship between food and nutrition intake, price, income and social development. The income of the majority of the rural population is focused on agriculture, livestock and related industries. These are essential sectors of the rural economy and are an opportunity for socioeconomic development, as they are a key source of rural cash income for poor and marginalized families. Agriculture and livestock policies could therefore be considered to increase income the poor and marginalized families.
- Gross and net substitution analysis shows higher income households have more substitutes between commodity food bundles compared to low income households. This means that higher income is positively connected to the pattern of consumption. This suggests that policy makers and government institutions should need to concentrate on income-generating activities across Pakistan to increase nutritious food consumption.
Novelty Statement
In terms of food and nutrition security, this study estimates the demand for food in Pakistan through the Quadratic Almost Ideal Demand System (QUAIDS) in order to understand the behavior of household consumption at national and regional levels to enable put in place better food security policies. In addition, this study uses share of food expenditure and reported price of the quantity (proxy of retail price) with household characteristics, for example, socioeconomic, demographic, provincial and regional variables, which was lacking in previous studies.
Author’s Contribution
Abdul Hameed: PhD scholar and this article is a part of his PhD dissertation.
Ihtsham ul Haq Padda: Verified analytical methods and supervised the findings of this work.
Abdul Salam: Supervised the overall direction and planning of this work and verified the theoretical and implication frame work.
Conflict of interest
The authors have declared no conflict of interest.
References
Aziz, B., K. Mudassa, Z. Iqbal and I. Hussain. 2011. Estimating food demand elasticities in Pakistan: An application of almost ideal demand system. Forman J. Econ. Stud., 7: 1-24.
Banks, J., R. Blundell and A. Lewbel. 1997. Quadratic engel curves and consumer demand. Rev. Econ. Stat., 79(4): 527-539. https://doi.org/10.1162/003465397557015
Blanciforti, L. and R. Green. 1983. An almost ideal demand system incorporating habits: An analysis of expenditures on food and aggregate commodity groups. Rev. Econ. Stat., 65(3): 511-515. https://doi.org/10.2307/1924200
Blundell, R., P. Pashardes and G. Weber. 1993. What do we learn about consumer demand patterns from micro data? Am. Econ. Rev., 83(3): 570-597.
Cashin, P., 1991. A model of the disaggregated demand for meat in Australia. Austral. J. Agric. Econ., 35(3): 263-283. https://doi.org/10.1111/j.1467-8489.1991.tb00509.x
Chambers, M.J., and K.B. Nowman. 1997. Forecasting with the almost ideal demand system: Evidence from some alternative dynamic specifications. Appl. Econ., 29(7): 935-943. https://doi.org/10.1080/000368497326598
Deaton, A., 1987. Estimation of own and price elasticities from household survey data. J. Econ., 36: 7-30. https://doi.org/10.1016/0304-4076(87)90041-8
Deaton, A. and J. Muellbauer. 1980a. Economics and consumer behavior. Cambridge: Cambridge University Press. https://doi.org/10.1017/CBO9780511805653
Deaton, A. and J. Muellbauer. 1980b. An almost ideal demand system. Am. Econ. Rev., 70: 312-326.
Dybczak, K., P. Tóth and D. Voňka. 2010. Effects of price shocks to consumer demand: Estimating the QUAIDS demand system on czech household budget survey data. Working Paper Series 8. Czech National Bank.
FAO, 2015. The state of food insecurity in the world. Rome: FAO.
GoP, 2014-15. Highlights of Pakistan economic survey 2014-15. Islamabad: Economic Adviser’s Wing, Finance Division, Government of Pakistan.
GoP, 2014-15a. Publication. Retrieved 12 07, 2017, from Ministry of national food security and research: http://www.mnfsr.gov.pk/frmDetails.aspx
GoP, 2017. Pakistan economic survey 2016-17. Islamabad: Economic Adviser’s Wing, Finance Division, Government of Pakistan.
Haider, A. and M. Zaidi. 2017. Food consumption patterns and nutrition disparity in Pakistan. 33rd Annu. Conf. Pak. Soc. Dev. Econ. Islamabad: Pak. Inst. Dev. Econ.,
Hameed, A. and I.u. Padda. 2017. Multidimensional child poverty measurement and its mapping: Case of Balochistan, Pakistan. 33rd Annual Conference of the Pakistan Society Development Economists. Islamabad: Pakistan Institute of Development Economics. https://doi.org/10.2139/ssrn.3149123
Holt, M.T. and B.K. Goodwin. 2009. Chapter 2 the almost ideal and translog demand. In D.J. Slottje (Ed.), Quantifying consumer preferences. Contributions to Economic Analysis ed., Emerald Group Publishing Limited., 288: 37-59. https://doi.org/10.1108/S0573-8555(2009)0000288005
John, M.E., A. Liam and Gallagher. 2003. Dynamic almost ideal demand systems: An empirical analysis of alcohol expenditure in Ireland. Appl. Econ., 35(9): 1025-1036. https://doi.org/10.1080/0003684032000066796
Jones, A.D., F.M. Ngure, G. Pelto and S.L. Young. 2013. What are we assessing when we measure food security? A compendium and review of current metrics. Am. Soc. Nutr. Adv. Nutr., 4: 481–505. https://doi.org/10.3945/an.113.004119
Mas-Colell, A., M. D., Whinston and J. R. Green. 1995. Microeconomic theory (Vol. 1). New York: Oxford university press.
Malik, S.J., H. Nazli and E. Whitney. 2014. Food consumption patterns and implications for poverty reduction in Pakistan. 30th Annual general meeting of Pakistan society of development economists. Islamabad: Pakistan institute of development economics.
Obayelu, A.E., V. Okoruwa and O. Ajani. 2009. Cross sectional analysis of food demand in the north Central, Nigeria. China Agric. Econ. Rev., 1(2): 173-193. https://doi.org/10.1108/17561370910927426
Poi, B.P., 2002. From the help desk: Demand system estimation. Stata J., 2(4): 403–410. https://doi.org/10.1177/1536867X0200200406
Poi, B.P., 2008. Demand-system estimation: Update. Stata J., 8: 554-556. https://doi.org/10.1177/1536867X0800800407
Poi, B.P., 2012. Easy demand-system estimation with quaids. Stata J., 12(3): 433–446. https://doi.org/10.1177/1536867X1201200306
Raknerud, A., T. Skjerpen and A.R. Swensen. 2007. Linear demand system with in a seemingly unrelated time series equations framework. Empirical Econ., 32: 105-124. https://doi.org/10.1007/s00181-006-0074-5
Ramíreza, A., 2013. A multi-stage almost ideal demand system: The case of beef demand in Colombia. Rev. Colombiana de Estadística, 36(1): 23-42.
Ray, R., 1983. Measuring the costs of children: An alternative approach. J. Publ. Econ., 22: 89–102. https://doi.org/10.1016/0047-2727(83)90058-0
Spielman, D.J., S.J. Malik, P.A. Dorosh and N. Ahmad. 2016. Agriculture and the rural economy in Pakistan: Issues, outlooks, and policy priorities. Philadelphia, PA: University of Pennsylvania Press on behalf of the International Food Policy Research Institute (IFPRI).
Suharno, 2002. An almost ideal demand system for food based on cross section data: Rural and urban East Java, Indonesia. Ph.D Dissertation. Indonesia: Der Georg-August-Universität Göttingen.
Thompson, W., 2004. Using elasticities from an almost ideal demand system? Watch out for group expenditure! Am. J. Agric. Econ., 86(4): 1108-1116. https://doi.org/10.1111/j.0002-9092.2004.00656.x
Tiffin, R. and m. Arnoult. 2010. The demand for a healthy diet: Estimating the almost ideal demand system with in frequency of purchase. Eur. Rev. Agric. Econ., 37(4); 501–521. https://doi.org/10.1093/erae/jbq038
Ullah, I. and A.U. Jan. 2016. An estimation of food demand in Pakistan using LA/AIDS. Sarhad J. Agric., 32(4): 382-393. https://doi.org/10.17582/journal.sja/2016.32.4.382.393
Wadud, M.A., 2006. An analysis of meat demand in Bangladesh using the almost ideal demand system. Empirical Econ. Lett., 5(1): 29-35.
WFP, 2015. Pakistan food security bulletin. Fighting hunger worldwide (3). Rome: World food programme.
World Bank, 2006. Repositioning nutrition as central to development: A strategy for large-scale action. Washington, DC: The World Bank.
World Bank, 2016. Poverty and shared prosperity 2016: Taking on inequality. Washington, DC: The World Bank.
Zhou, X., 2015. Using almost ideal demand system to analyze demand for shrimp in US food market. Int. J. Food Agric. Econ., 3(3): 31-46.
To share on other social networks, click on any share button. What are these?