
Evaluation of Local and Exotic Hybrid Genotypes of Yardlong Bean (Vigna unguiculata) in Saline Prone Area of Bangladesh


Evaluation of Local and Exotic Hybrid Genotypes of Yardlong Bean (Vigna unguiculata) in Saline Prone Area of Bangladesh
Shakil Ahmed1, Mahin Das2, Md. Rayhan Sojib3*, Shishir Kanti Talukder4, Sadia Sultana5, Prantika Datta1, Shofiqul Islam1 and Gazi Md. Mohsin2

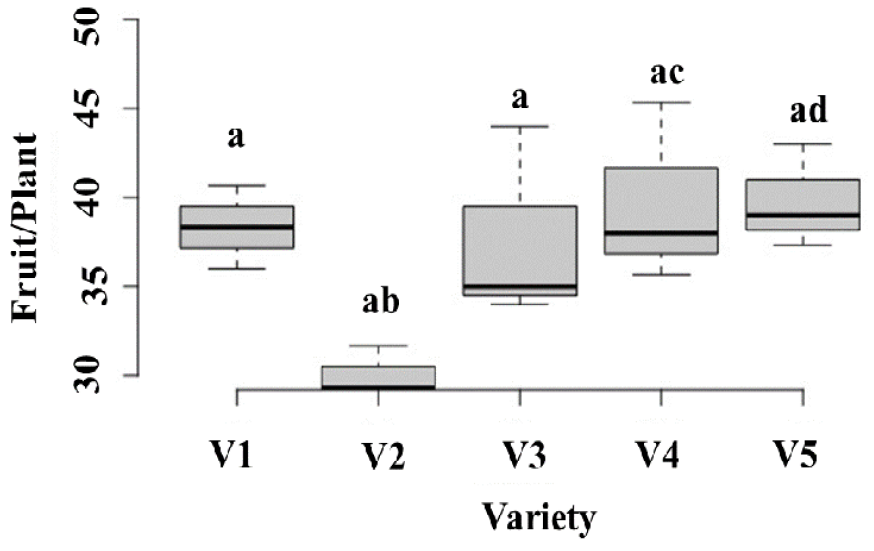
Number of fruits per plant in different varieties V1 (Saba), V2 (Lalbeni), V3 (White Beauty), V4 (Toki) and V5 (1070). Boxes: the interquartile range. Lines across the boxes: the average of the values. The line above and below the vertical dashed lines: the maximum and minimum values. The letters a, ab, b, . . . indicate significant differences between boxes.
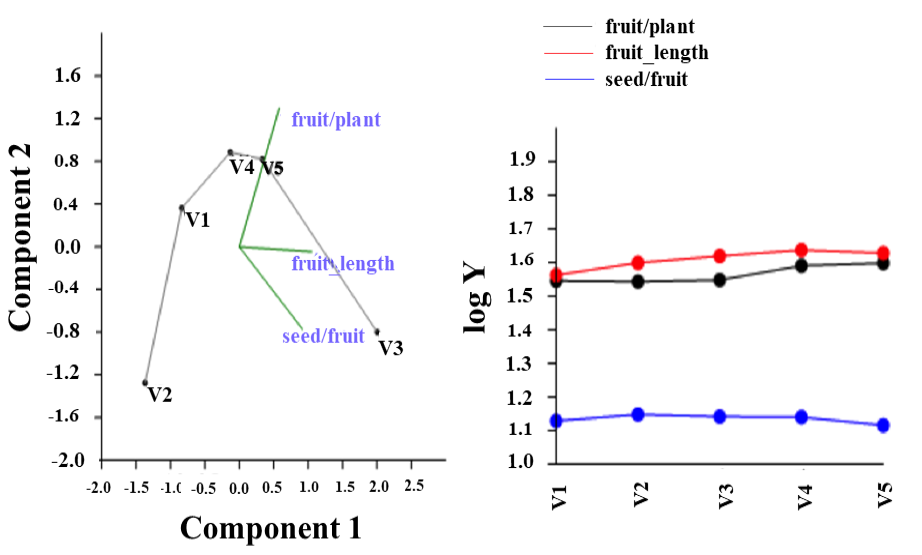
Principal component analysis (PCA) biplot showing interaction between varieties of Long yard beans and selected traits. fruit/plant = Number of fruits per plants, seed/fruit = Number of seeds per fruit.

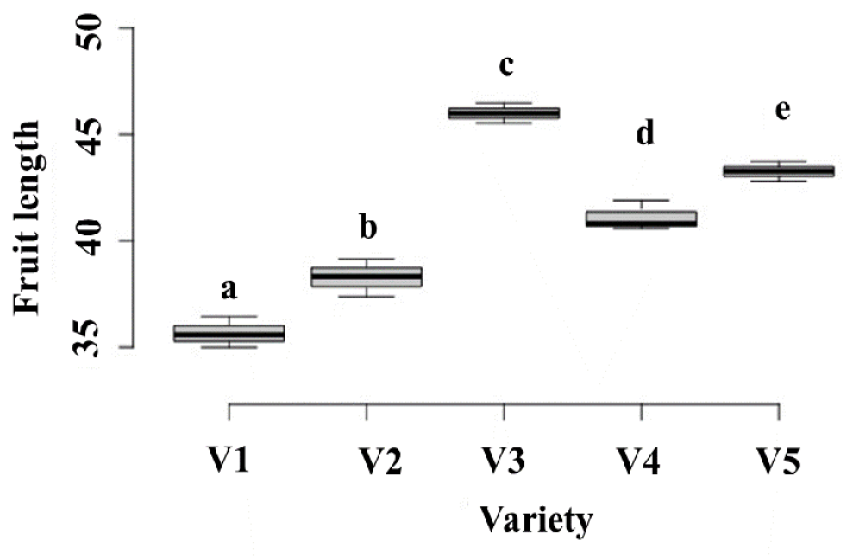
Fruit length in different varieties V1 (Saba), V2 (Lalbeni), V3 (White Beauty), V4 (Toki) and V5 (1070). Boxes: the interquartile range. Lines across the boxes: the average of the values. The line above and below the vertical dashed lines: the maximum and minimum values. The letters a, b, c, . . . indicate significant differences between boxes.

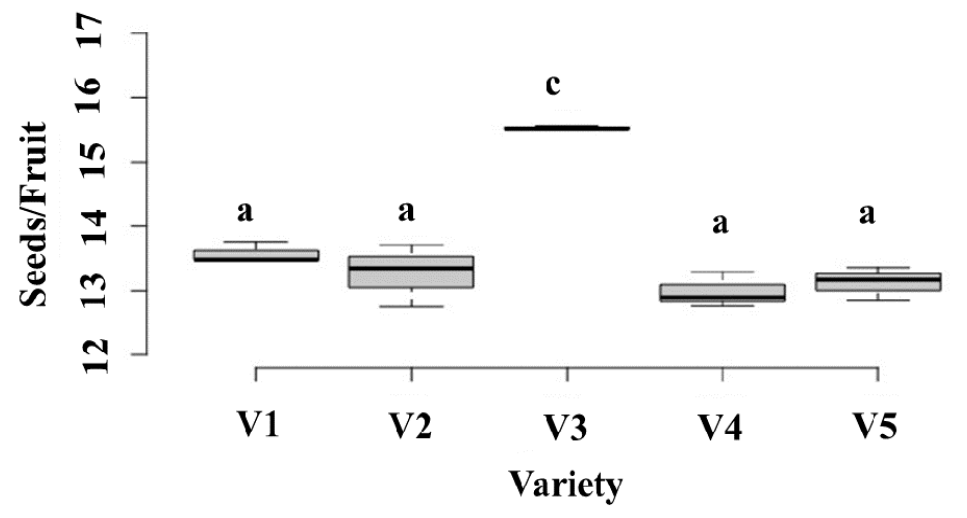
Seeds per fruit in different varieties V1 (Saba), V2 (Lalbeni), V3 (White Beauty), V4 (Toki) and V5 (1070). Boxes: the interquartile range. Lines across the boxes: the average of the values. The line above and below the vertical dashed lines: the maximum and minimum values. The letters a, b, c, . . . indicate significant differences between boxes.


