

Identification of the Top 10 Core Genes as Diagnostic and Therapeutic Targets in Hepatocellular Carcinoma (HCC)


Identification of the Top 10 Core Genes as Diagnostic and Therapeutic Targets in Hepatocellular Carcinoma (HCC)
Qiangsheng Wu1, Yumei Yin2, Hui Gao1, Baoding Chen3, Jianjun Yu2, Jian Zhang4, Donglai Zhu5, Fang Liu6, Guohong Ge7 and Ya-Mei Dang8*
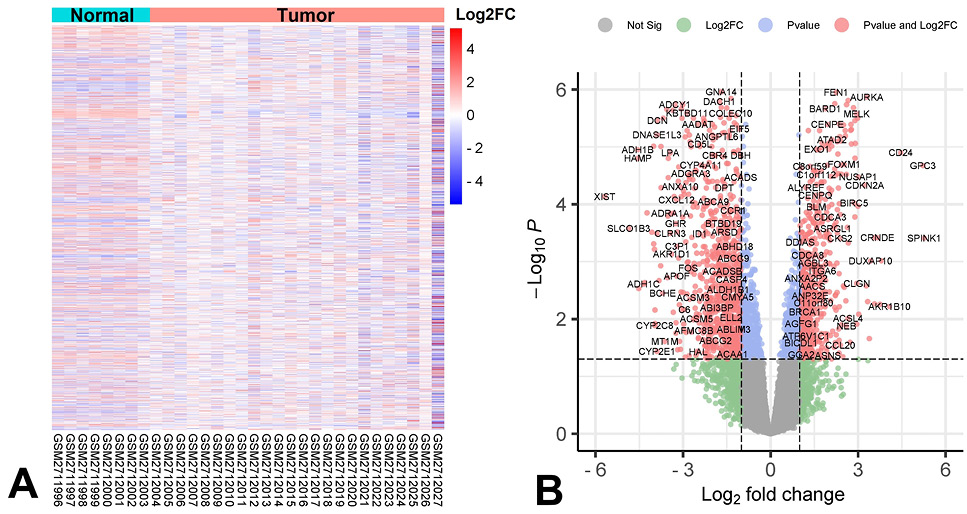
Different-expressed genes in HCC tumor tissue. (A) The gene expression profile in normal liver tissue and HCC tissue. (B) Statistically significant up-regulated or down-regulated expressed genes (red) in HCC tissue.
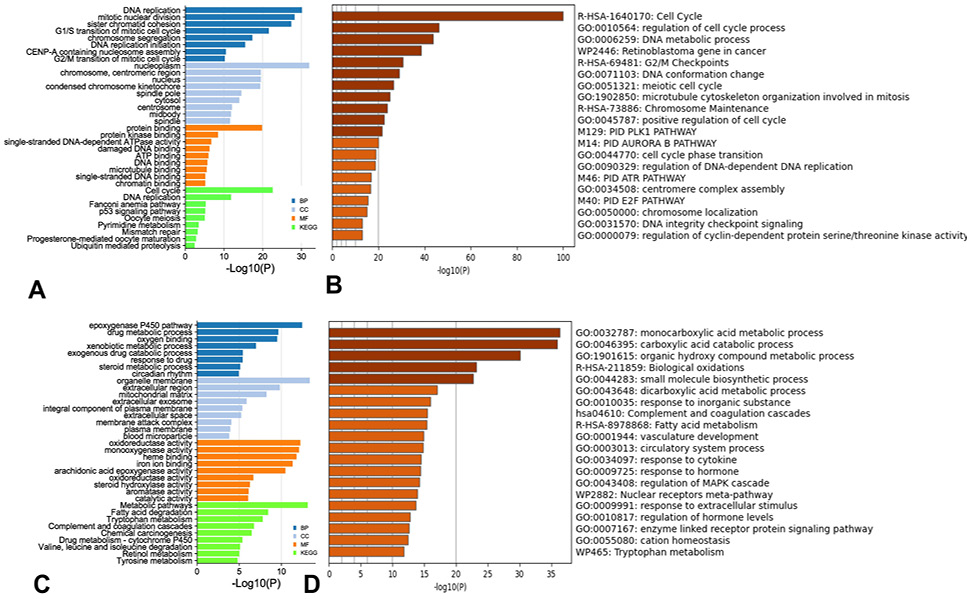
Enrichment analysis of the DEG in HCC. Bar plot of GO (BP, CC, MF) and KEGG enriched items of up-regulated genes analyzed by DAVID 6.8 (A) and Metascape (B). Bar plot of GO (BP, CC, MF) and KEGG enriched items of down-regulated genes analyzed by DAVID 6.8 (C) and Metascape (D).
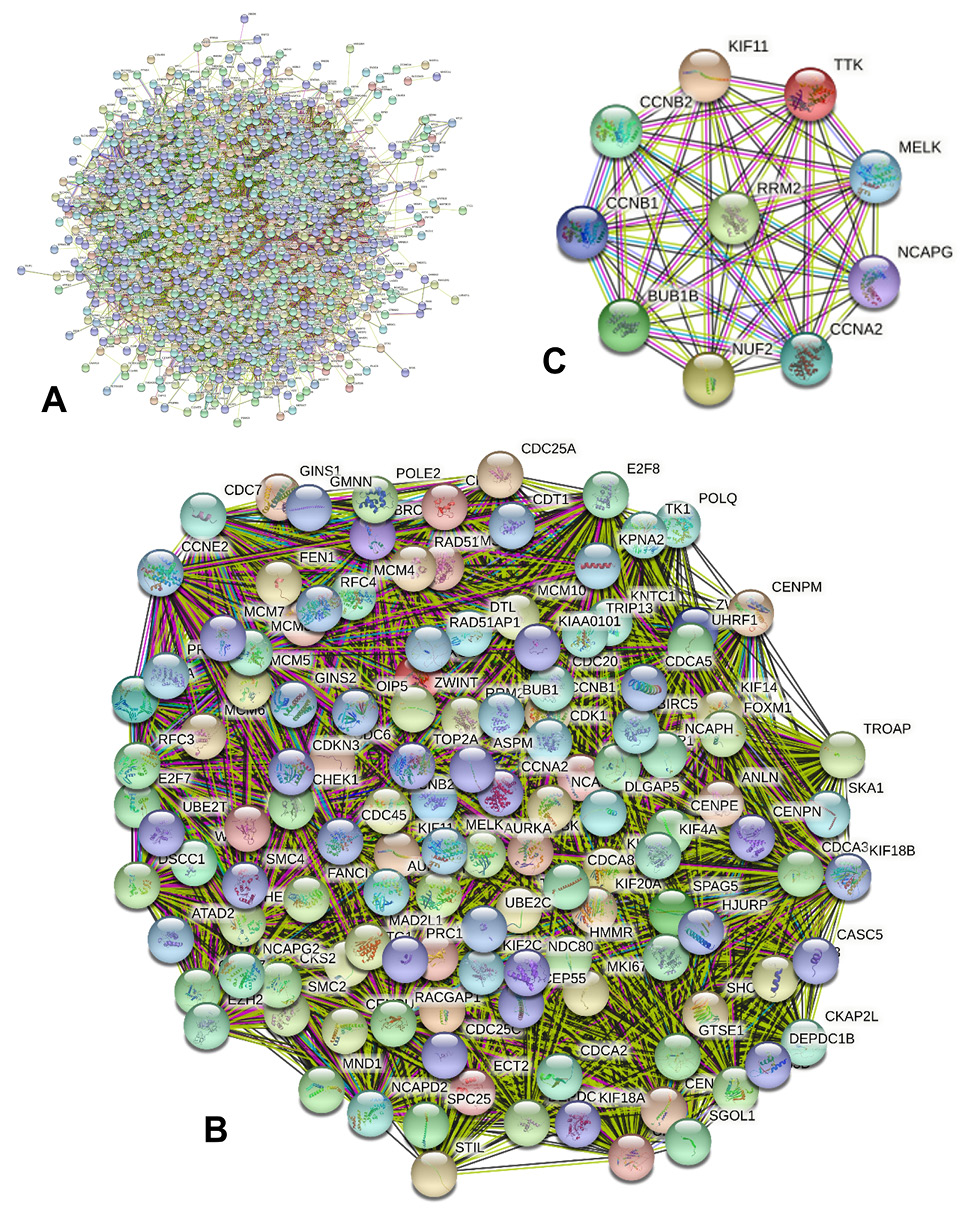
Interaction network, mCODE and the top 10 core genes analyses of the DEGs in HCC. (A) Protein-protein interaction network of the DEGs in HCC (STRING). (B, C) The most significant mCODE and top 10 core genes of the DEGs in HCC (cytoscape).
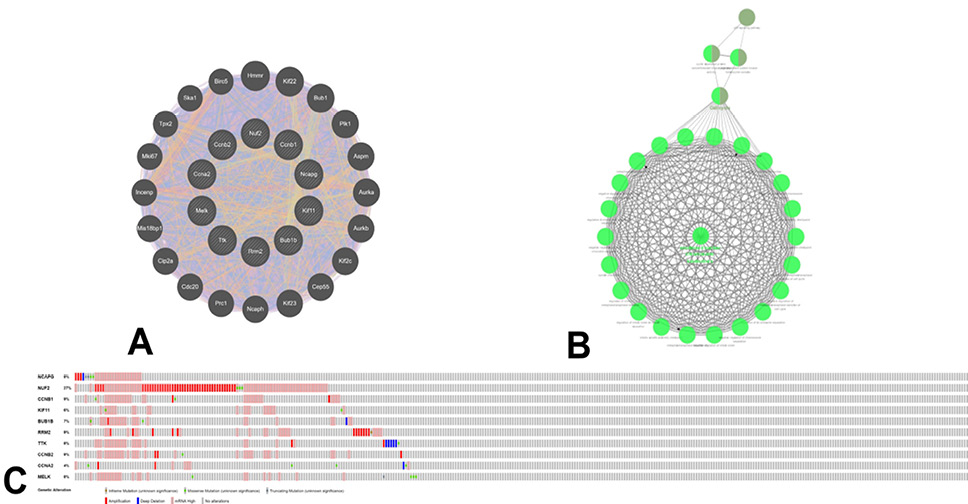
Neighbor gene network, functional enrichment and genetic alteration of the top 10 core genes in HCC. Gene-gene interaction network (A) and the functional enrichment (B) of the top 10 core genes and their neighbor genes. (C) Summary of genetic alteration of the top 10 core genes in HCC.
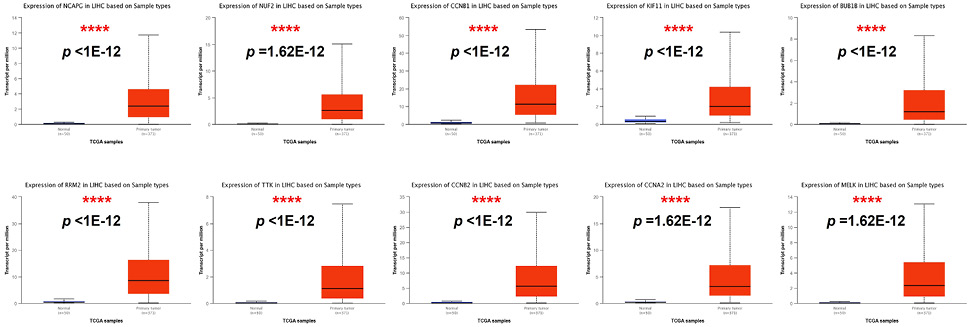
The transcriptional levels of the top 10 core genes in HCC. Compared the transcription of NCAPG, NUF2, CCNB1, KIF11, BUB1B, RRM2, TTK, CCNB2, CCNA2 and MELK of HCC tissues with the normal tissues (UALCAN). LIHC represents liver hepatocellular carcinoma. ****, p < 0.0001.

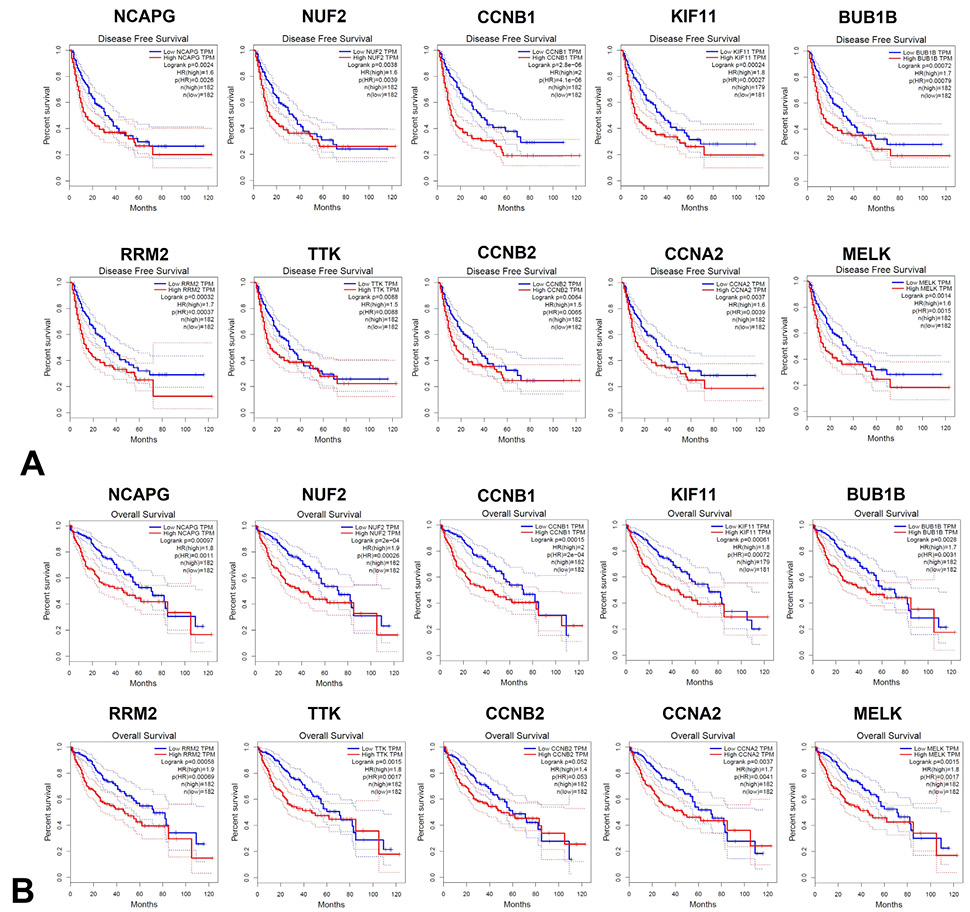
The prognostic value of the top 10 core genes in patients with HCC. The disease-free survival (A) and overall survival (B) curves of NCAPG, NUF2, CCNB1, KIF11, BUB1B, RRM2, TTK, CCNB2, CCNA2 and MELK in HCC.

