Litter Size Trait as a Selection Criterion in Merino Crossbred Rams


Litter Size Trait as a Selection Criterion in Merino Crossbred Rams
Widya Pintaka Bayu Putra1, Herman W Raadsma2, Indriawati1,
Slamet Diah Volkandari1 and Endang Tri Margawati1*
1Research Center for Biotechnology, Research Organization for Life Sciences, National Research and Innovation Agency, Cibinong 16911, West Java, Indonesia
2Center for Advanced Technologies in Animal Genetics and Reproduction, Faculty of Veterinary Science, University of Sydney, Camden, NSW, Australia 2006
ABSTRACT
Litter size is a reproductive trait of economic importance in small ruminants. This study was carried out to investigate litter size (LS) as a selection criterion in Merino rams using Estimated Breeding Value (EBV). Hence, the heritability (h2) value was estimated with paternal halfshib correlation model through analysis of variance (ANOVA) method. A total of 650 records of LS were used in this study, representing in the progeny of fourteen (14) rams collected from year 1999 to 2004 at Cimanglid Research Park, Bogor, Indonesia. This study showed that the average of LS in sheep samples was 1.34±0.51 with h2 value of 0.04±0.06 (low). However, six Merino rams (43%) had positive of EBV value. Moreover, the data records of LS from each observed ram were sufficient for evaluation and signed by a moderate relative accuracy (RA) value ranged from 0.27 to 0.71. It can be concluded that selection of Merino rams can be performed based on LS using EBV.
Article Information
Received 05 February 2021
Revised 03 November 2021
Accepted 12 November 2021
Available online 10 June 2022
(early access)
Published 20 April 2023
Authors’ Contribution
WPBP and ETM designed the research. WPBP performed data analysis and manuscript writing. ETM and HWR finalized manuscript writing and correction. ETM and SDV collected data.
Key words
Estimated breeding value, Heritability, Litter size, Merino sheep, Relative accuracy
DOI: https://dx.doi.org/10.17582/journal.pjz/20210205030242
* Corresponding author: endangtri@hotmail.com
0030-9923/2023/0003-1485 $ 9.00/0
Copyright 2023 by the authors. Licensee Zoological Society of Pakistan.
This article is an open access article distributed under the terms and conditions of the Creative Commons Attribution (CC BY) license (https://creativecommons.org/licenses/by/4.0/).
Merino sheep have been used to produce wool and meat in many countries in the world. Brand et al. (2018) reported that the slaughter weight, carcass weight and dressing percentage in Merino sheep were 42.70±0.81kg; 18.20±0.41 kg and 42.50±0.28%, respectively. Hence, Merino sheep have been crossed with other sheep breeds for meat and wool production purpose in many countries. In Indonesia, Merino sheeps are often mated to local sheep for meat production. Batur sheep is one of Indonesian native sheep that has genetic introduction from Merino sheep, it was reported based on random amplyfied polymorphism DNA analyses (Prayitno, 2010).
Apart of productive traits (wool and meat), reproductive traits of sheep are also of economic significance. Litter size (LS) is one of the reproductive traits in sheep that directly affects the lambing crop. Despite its importance, the heritability value of LS is considered lowto moderate (Hansen and Shrestha, 1997; Rosati et al., 2002; Yafarivard et al., 2015) and thus amenable for selection. Genetic improvement for LS trait can be performed with selection programs through either molecular or conventional methods. However, selection for traits with low heritability value causes low selection response (Bourdon, 2000). Previous studies have used the LS trait as selection criteria with conventional method to increase the number of offspring in pig (Long et al., 1991), Romney Marsh sheep (Bhuiyan and Curran, 1993) and Markhoz goat (Abdoli et al., 2019). In conventional methods, superior animals are typically selected based on their estimated breeding value (EBV) (Bourdon, 2000).
Crossbreeding is one of selection methods to produce offspring with many desirable traits from different breeds (Hardjosubroto, 1994). In Indonesia, the crossbred sheep of Pribados (50% Barbados; 50% Priangan) and composite Garut (50% Garut; 25% St. Croix; 25% Moulton Charollais) were developed to increase the meat production (Rahmat et al., 2006; Priyanto and Adiati, 2013). Unfortunately, studies to evaluate LS as a trait in Merino cross bred sheep reared in Indonesia have not been reported. Hence, this study was carried out to select the best Merino rams kept in Indonesia based on LS trait using EBV derived under conventional methods. The result of this study is important to the farmers (stakeholders) as the basic information for improving reproductive traits of sheep.
Materials and methods
A total of 650 records data of litter size (LS) of Merino backcross (F1 of (Garut x Merino) x Merino ewes) were applied. The progeny was bred from 14 Garut rams (Iindonesian Thin-tailed/ITT sheep) mated to Merino ewes selected at random. The F1 rams were then mated to Merino ewes and LS data collected from year 1999 to 2004 at Cimanglid Research Park, Bogor, West Java of Indonesia. The research park is located at 15-150 (m above the sea level with temperature is about 20-30°C with relative humidity is about 70% and rainfall is 2500 - 5000 mm/year. All sheep were kept under cover and hand fed throughout the entire study as described below. After weaning, the animal samples (backcross) were moved and reared at the Research Centre for Biotechnology– LIPI, Cibinong, West Java of Indonesia.
The sheep were reared in colony stalls with intensive management system. The feed ration consisted of Elephant grass (Pennisetum purpureum) and commercial concentrate containing of 14% of crude protein, 4% of fat, 7% of crude fiber, 8% of ash, 12% of digested protein and 60% of total digestible nutrient (TDN). Water was given by ad libitum and health examination was taken every month. The natural mating was managed in this research park, with breeding as above (Garut × Merino × Merino) ewes to produce generation 2 (G2) of backcross Merino lambs (75% Merino; 25% Garut) as ilustrated in Figure 1.
The pedigree of all sheep were confirmed by DNA parentage assignment using microsatellite markers (Margawati et al., 2002). Data of LS in this study was used for estimating heritability (h2) value using paternal halfsib correlation model through analysis of variance (ANOVA) with a mathematical formula according to Becker (1992) as follows:
Yik = μ + Si + Eik
Where, Yik is the observation of trait; μ is the common mean; Si is the effect of ith sire and Eik is the experimental error. Hence, h2 value was estimated using mathematical formula according to Becker (1992) as follows:
h2 = 4t
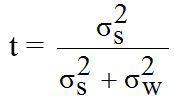
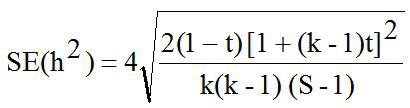
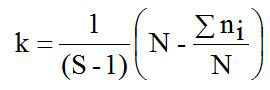
Where, h2 is the heritability; t is the constant; σ2s is the variance component of sire; σ2w is the variance component of records; S is the number of sire; k is the constanta to estimate the number of progeny per sire; ni is the number of records data per sire; N is the total of records data.
The estimated breeding value (EBV) of LS for sire (ram) was analyzed with mathematical formula according to Hardjosubroto (1994) as follows:
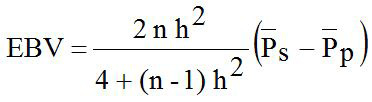
Where, EBV is the estimated breeding value; h2 is the heritability; n is the number of records data in observed sire; P̅s is the average trait in observed sire; P̅P is the average trait of population.
The relative accuracy (RA) was estimated in this study to obtain the best rams based on records data accurately with mathematical formula according to Warwick et al. (1990) as follows:
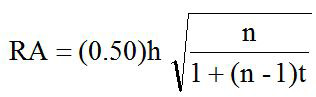
t = R h2
Where, RA is the relative accuracy; n is the number of records data in observed sire; R is the constanta of 0.25 (halfsib correlation); h is the root of h2; h2 is the heritability. The data analysis was computed by using Microsoft Excel 2007 computer program.
Results and discussion
The average litter size (LS) in Merino×Garut (MEGA) ewes was 1.34±0.51 as presented in Table I, with range of 1.16 to 1.47. Previous studies reported the average of LS in some Indonesian native sheep of Fat-Tailed (1.54), Thin-Tailed (1.82), Batur (1.55), Priangan (1.51), Garut (1.69) and Dombos/Texel (1.45) breeds (Sodiq, 2010; Najmuddin and Nasich, 2019; Sodiq et al., 2011; Choiria et al., 2016; Al-Banani, 2019; Hakim et al., 2019). Moreover, the average of LS in Indonesian crossbred sheep of Pribados and composite Garut were 1.91 and 1.37 respectively (Rahmat et al., 2006; Priyanto and Adiati, 2013). The average LS in the MEGA ewes was similar to that for the composite Garut ewes. LS can be affected by age of ewe (parity), breed (genetic) and nutrition (Hafez, 1968). The highest LS in ewes studied here was 4.00 with mated by Rams ID: 1263. In addition, the highest LS value in studied ewes was 1.47±0.54 and reached by Rams ID: 1267.
Table I. Descriptive statistics of litter size in the Merino × Garut (MEGA) rams mated with non selected Merino ewes.
|
Rams ID |
N |
Mean±SD (Range) |
CV (%) |
|
1258 |
43 |
1.42±0.50 (1.00 - 2.00) |
35.19 |
|
1261 |
98 |
1.36±0.50 (1.00 - 3.00) |
37.03 |
|
1262 |
79 |
1.39±0.49 (1.00 - 2.00) |
35.29 |
|
1263 |
88 |
1.39±0.60 (1.00 - 4.00) |
42.96 |
|
1265 |
38 |
1.32±0.47 (1.00 - 2.00) |
35.80 |
|
1266 |
19 |
1.21±0.42 (1.00 - 2.00) |
34.60 |
|
1267 |
53 |
1.47±0.54 (1.00 - 3.00) |
36.75 |
|
1268 |
27 |
1.19±0.48 (1.00 - 3.00) |
40.78 |
|
1269 |
11 |
1.18±0.40 (1.00 - 2.00) |
34.23 |
|
1273 |
76 |
1.36±0.51 (1.00 - 3.00) |
37.53 |
|
1274 |
8 |
1.25±0.46 (1.00 - 2.00) |
37.03 |
|
1348 |
31 |
1.16±0.37 (1.00 - 2.00) |
32.20 |
|
1578 |
46 |
1.20±0.45 (1.00 - 3.00) |
37.90 |
|
1630 |
33 |
1.33±0.48 (1.00 - 2.00) |
35.90 |
|
Total |
650 |
1.34±0.51 (1.00 - 4.00) |
37.73 |
N, number of records; SD, standard deviation; CV, coefficient of variation.
The heritability (h2) value in this study was 0.04 and is considered as low category (h2<0.10) as presented in Table II. Abdoli et al. (2019) reported the low of h2 value was in commercial (0.10) and Markhoz (0.002±0.007) sheep (Rosati et al., 2002; Abdoli et al., 2019). Meanwhile, the moderate (0.11<h2<0.30) to high (h2 > 0.31) of h2 value were reported in Canadian (0.13±0.02); Outaouais (0.13±0.02); Rideau (0.12±0.02) and Mehraban (0.16±0.04) sheep (Hansen and Shresta, 1997; Yavarivard et al., 2015). The low of h2 value may be due to the importance of random environmental effects on variability of the observations and due to categorycal expression of trait (Bourdon, 2000). Therefore, high standard error (SE) of h2 values can be caused by statistical analysis methods, low number of progeny and low number of sires used. According to estimated h2 value, improvement of LS trait in animals study would be difficult even though LS has great economical importance. Moreover, about 5% the LS variation in animals study was affected by genetic paternal effect. Unfortunately, the genetic maternal effect in the present study can not be estimated because of limited records data information.
Table II. The result of variance analysis (ANOVA) to estimate heritability (h2) value for litter size trait in backcross Merino sheep of Indonesia.
|
Source of variation |
DF |
SS |
MS |
σ2s |
σ2e |
k |
h2 |
SE(h2) |
|
Sire |
13 |
4.91 |
0.38 |
0.003 |
0.25 |
45 |
0.04 |
0.06 |
|
Residual |
636 |
160.62 |
0.25 |
|||||
|
Total |
649 |
DF, degree of freedom; SS, sum of square; MS, means of square; σ2s, variance component of sire; σ2e, variance component of records; k, constanta; h2, heritability; SE(h2), standard error of progeny.
Table III. The estimated breeding value (EBV) and relative accuracy (RA) to select the best Merino rams based on litter size trait.
|
Ram’s ID |
EBV |
RA |
Rank |
Remark |
|
1258 |
+0.05 |
0.55 |
2 |
Selected |
|
1261 |
+0.02 |
0.29 |
4 |
Selected |
|
1262 |
+0.04 |
0.29 |
3 |
Selected |
|
1263 |
+0.05 |
0.29 |
2 |
Selected |
|
1265 |
-0.01 |
0.27 |
5 |
Culling |
|
1266 |
-0.04 |
0.25 |
8 |
Culling |
|
1267 |
+0.09 |
0.28 |
1 |
Selected |
|
1268 |
-0.06 |
0.26 |
9 |
Culling |
|
1269 |
-0.03 |
0.23 |
7 |
Culling |
|
1273 |
+0.02 |
0.29 |
4 |
Selected |
|
1274 |
-0.01 |
0.21 |
6 |
Culling |
|
1348 |
-0.09 |
0.27 |
10 |
Culling |
|
1578 |
-0.09 |
0.28 |
10 |
Culling |
|
1630 |
-0.01 |
0.50 |
5 |
Culling |
Although h2 value of LS in animals study is small, total of six studied rams (43%) capable to select based on estimated breeding value (EBV) of this trait as presented in Table III. The EBV of LS (EBVLS) in animals study was ranged from -0.09 (Rams ID: 1348 and 1578) to +0.09 (Rams ID: 1267). Hence, the highest of relative accuracy (RA) value was 0.55 in rams ID: 1258 with 43 progeny for evaluation. Sumadi et al. (2017) reported that the highest RA value of 0.80 in bull ID: JIMIN with 18 progeny for evaluation. The RA value can be affected by number of records data in each observed sire and h2 value.
Studies of EBV for LS trait in sheep are very limited. Bhuiyan and Curran (1993) reported that the EBV of LS in Romney Marsh sheep was capable to improve from 0.03 to +2.77 during six years. In the future, selection of reproductive traits must be supported by molecular approach using Marker Assisted Selection or genomic selection (GS) to improve the accuracy of EBV. Ahlawat et al. (2015) stated that molecular genetic techniques are promising where they have ability to analyse genetic variability at the DNA level by detecting causal genes for reproductive characteristics or marker closely linked to underlying QTL.
Conclusions and recommendations
The h2 value of LS was 0.04 and considered low. However, selection of observed rams based on LS trait was revealed six rams (43%) with positive of EBVLS. Meanwhile, the highest of EBVLS was +0.09 and reached by Rams ID: 1267. In conclusion, LS trait can be used as the selection criteria in observed rams.
Acknowledgments
This research was possible due to available data from ACIAR (Australian Centre for International Agricultural Research) project (AS1/9727). Authors are greatful to some colleagues who helped in collecting field data at the Research Centre for Biotechnology - LIPI (Indonesian Institute of Sciences).
Statement of conflict of interest
The authors have declared no conflict of interests.
References
Abdoli, R., Zamani, P., Mirhoseini, S.Z., Hossein-Zadeh, N.G. and Almasi, M., 2019. Rev. Colomb. Cienc. Pecu., 32: 58-63. https://doi.org/10.17533/udea.rccp.v32n1a07
Ahlawat, S., Sharma, R., Maitra, A. and Tantia, M.S., 2015. Small Rumin. Res., 125: 34–42. https://doi.org/10.1016/j.smallrumres.2015.01.027
Al-Banani, A.U., 2019. Productivity and reproduction index of ewes in Margawati Breeding in Garut regency. B.Sc thesis. Jenderal Soedirman University, Purwokerto, Indonesia.
Becker, W.A., 1992. Manual of quantitative genetics. 5th edn. Academic Enterprises Valllman, USA.
Bhuiyan, A.K.F.H. and Curran, M.K., 1993. Small.Rumin. Res., 12: 315-320. https://doi.org/10.1016/0921-4488(93)90066-Q
Bourdon, R.M., 2000. Understanding animal breeding: 2nd edn. Colorado StateUniversity Press, USA.
Brand, T.S., van der Westhuizen, E.J., van Der Merwe, D.A. and Hoffman, L.C., 2018. S. Afr. J. Anim. Sci., 48: 477-488. https://doi.org/10.4314/sajas.v48i3.8
Choiria, R., Nurachma, S. and Ramdani, D., 2016. Available at: http://www.jurnal.unpad.ac.id. (accessed 10 Jan 2020).
Hafez, E.S.E., 1968. Reproduction in farm animals: 2nd edn. Lea and Febiger, USA.
Hakim, F.R., Arifin, M. and Rianto, E., 2019. IOP Conf. Ser. Earth Env. Sci., 247: 012044. https://doi.org/10.1088/1755-1315/247/1/012044
Hansen, C. and Shrestha, J.N.B., 1997. Small Rumin. Res., 24: 185-194. https://doi.org/10.1016/S0921-4488(96)00952-2
Hardjosubroto, W., 1994. Aplikasi pemuliabiakan di lapangan. Gramedia Widiasarana, INA.
Long, T.E., Johnson, R.K. and Keele, J.W., 1991. J. Anim. Sci., 69: 2787-2794. https://doi.org/10.2527/1991.6972787x
Margawati, E.T., Tammen, I., Jones, M., and Raadsma, HW., 2002. Berita Biol., 6: 475-479.
Najmuddin, M. and Nasich, M., 2019. J. Ternak Tropika, 20: 76-83. https://doi.org/10.21776/ub.jtapro.2019.020.01.10
Prayitno., 2010. Analisis genetik dan kekerabatan domba Batur dengan domba lokal dan Merino menggunakan marker Random Amplyfied Polymorphism DNA. Lembaga Penelitian dan Pengabdian Kepada Masyarakat, Universitas Gadjah Mada, Yogyakarta, YK.
Priyanto, D. and Adiati, U., 2013. In: Proc. Nat. Sem. Anim. Husb. Vet. Technol. Bogor, Indonesia. pp. 519-529.
Rahmat, D., Dhalika, T. and Dudi., 2006. J. Ilmu. Ternak., 6: 96-101.
Rosati, A., Mousa, E., van Vleck, L.D. and Young, L.D., 2002. Small Rumin. Res., 43: 65-74. https://doi.org/10.1016/S0921-4488(01)00256-5
Sodiq, A., 2010. Agripet, 10: 25-31. https://doi.org/10.17969/agripet.v10i1.634
Sodiq, A., Yuwono, P. and Santosa, S.A., 2011. Anim. Prod., 13: 166-172.
Sumadi, Fathoni, A., Maharani, D., Ngadiyono, N., Widayatai D.T. Noviandi, C.T. and Khusnudin, M. 2017. J. Indones. Trop. Anim. Agric., 42: 160-166. https://doi.org/10.14710/jitaa.42.3.160-166
Warwick, E.J., Astuti, J.M. and Hardjosubroto, W., 1990. Pemuliaan ternak. Gadjah Mada University Press, INA.
Yavarifard, R., Hossein-Zadeth, G. and Shadparvar, A.A., 2015. Czech J. Anim. Sci., 60: 281-288. https://doi.org/10.17221/8242-CJAS
To share on other social networks, click on any share button. What are these?