

Microarray and Bioinformatics Analysis of Differentially-Expressed MicroRNAs in Wnt/Β-Catenin Signaling-Activated Bovine Skeletal Muscle Satellite Cells


Microarray and Bioinformatics Analysis of Differentially-Expressed MicroRNAs in Wnt/Β-Catenin Signaling-Activated Bovine Skeletal Muscle Satellite Cells
Ming-Yan Shi2, Xu-Liang Yan1, Ping-Ping Han1, Yu-Jie Tang1 and Hui-Xia Li1*
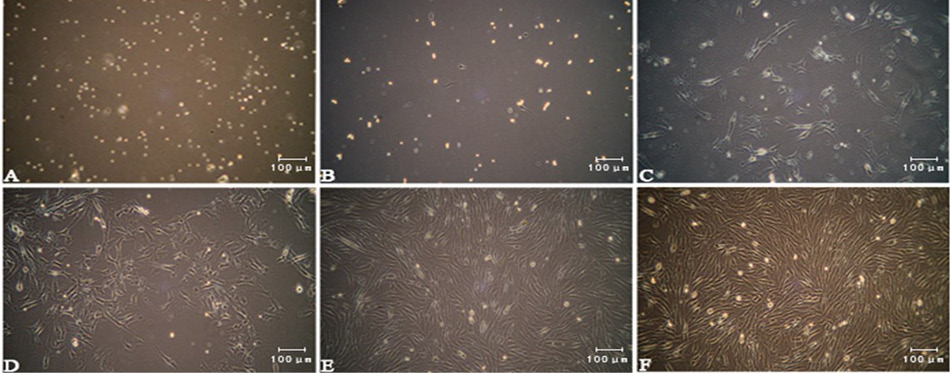
(A) Bovine skeletal muscle satellite cells (bSMSCs) cultured in vitro; primitive bSMSCs were rounded and had strong refraction; (B) The fast-adhered cells were fibroblasts and the bSMSCs were round and suspended; (C) Two days later, the bSMSCs were spindles and proliferating rapidly; (D, E, F) After two cell passages and differential adhesion, the cells were confluent and became homogeneous in their appearance.
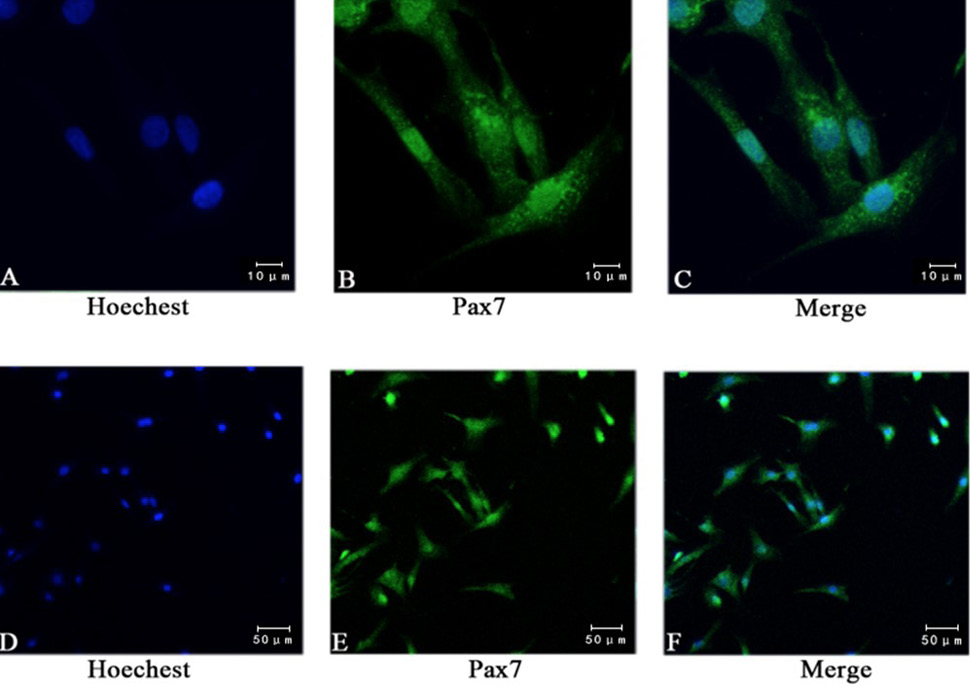
Immunofluorescence staining showed the expression of pax7. (A, D) Staining nuclei with Hoechst; (B, E) Using anti pax7 antibody immunofluorescence staining, 95% of the cells were positive; (C, F) Pax7 and Hoechst composite picture. (A, B, C bar = 10 μm; D, E, F bar = 50 μm).

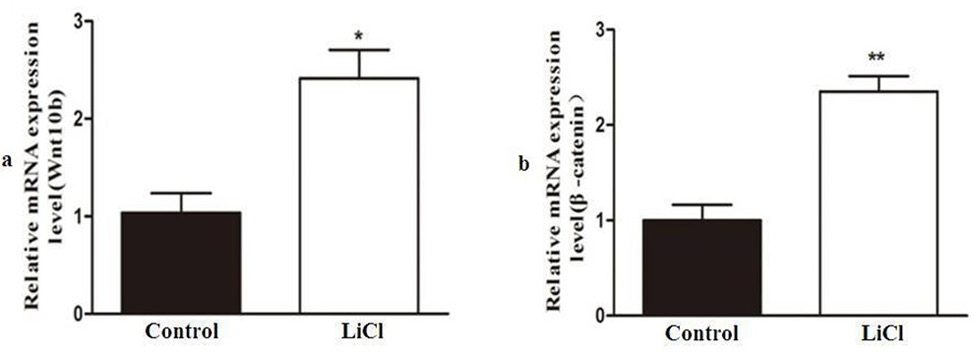
Skeletal muscle satellite cells were treated with LiCl to activate Wnt signaling. (a) Wnt10b and (b) β-catenin microRNA expression levels were detected by quantitative real-time PCR. * P < 0.05; **P < 0.01.

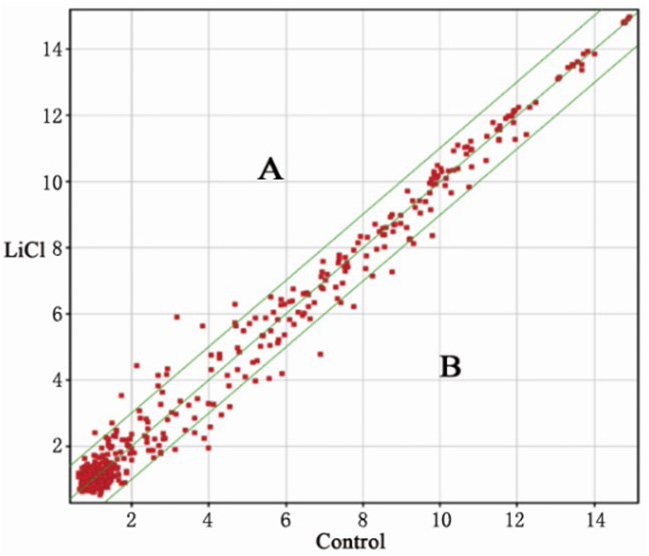
The spot falling on graph y=x line (the median line on the graph) represents the probe point signal values differences in the two chips (fold change=1). Graph points fall on both sides of the bit line, which is outside the 45° line, representing the difference between the value of the probe signal point in the two chips (fold change >2). An area: 2x increased microRNAs (miRNAs); B area: 2x decreased miRNAs.
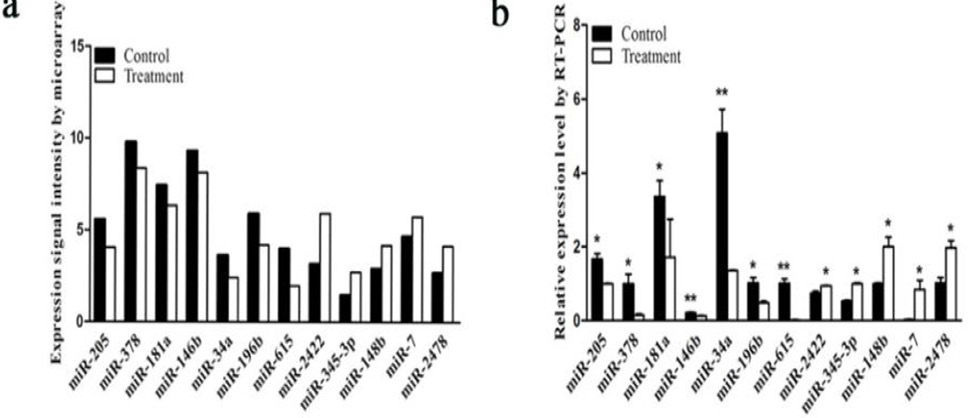
Expression of miRNAs by quantitative real-time PCR (qRT-PCR) and microarray signal intensity. (a) Relative detectable signal intensity of differentially expressed miRNAs between different models using microarray. (b) Relative expression levels of differentially expressed miRNAs by qRT-PCR. *P < 0.05; **P < 0.01.

