Morpho-Biochemical Parameters Associated with Resistance to Pod Borer Complex of Pigeonpea


Morpho-Biochemical Parameters Associated with Resistance to Pod Borer Complex of Pigeonpea
Vishal Ambidi 1,3, Sanjeev Bantewad2, Suraj Prasad Mishra1, Anupama Hingane1 and Jagdish Jaba1*
1International Crop Research Institute for the Semi Arid Tropics, Patancheru, Hyderabad -502324, India.
2Agriculture Research Station, Badnapur, Jalna-431202, India.
3College of Agriculture, Badnapur, Jalna- 431202, India
ABSTRACT
Host plant resistance is an important component for minimizing the losses due to the pod borer, Helicoverpa armigera and other pod borer complex. Among pod borer, which is the most devastating pest of pigeonpea. An understanding of different morphological and biochemical components of resistance is essential for developing strategies to breed for resistance to insect pests. morphological and biochemical components associated with expression of resistance to pod borer complex in Pigeonpea hybrids and cultivars to identify accessions with a diverse combination of characteristics associated with resistance to this pest. Among the genotypes ICPH 3461, ICPH 3762, BSMR 853, ICPL 332 WR, ICPH 2740, ENT 11 showed least preference for pod borer complex as compared to susceptible check ICPL 87. In context to morphological factors pod wall thickness, trichome density of type C and D on calyx and pod with correlation coefficient (r) (-0.508*), ( -0.717**, -0.748**), (-0.810**, -0.749**) exhibited a strong negative association with percent pod damage by pod borer complex. Among the biochemical factors protein, sugar content in pigeonpea seeds exhibited significant positive correlation with correlation coffecient (r) being (0.710**, 0.843**), respectively with percent pod damage by pod borer complex. Whereas, total phenols, tannins, total flavonoids present in seeds showed significant negative correlation with correlation coffecient (r) being (-0.729**, - 0.650**, -0.783**), respectively with percent pod damage by pod borer complex. Thus genotypes with maximum pod wall thickness, high non glandular trichome density and high phenol, tannins, flavonoids content in pigeonpea genotypes showed tolerance to pod borer complex.
Article Information
Received 03 July 2020
Revised 29 August 2020
Accepted 24 November 2020
Available online 05 May 2021
(early access)
Published 17 December 2021
Authors’ Contribution
The idea was conceived by JJ and SB. AV generated all data. AH supported to issue of prominent hybrid lines for screening for pod borer complex. SPM analysed and guided in trait analysis. AV drafted sections of the manuscript and prepared tables and figures. JJ made a critical revision of the content of the manuscript.
Key words
Pigeonpea, Host plant resistance, Morphological traits, Biochemical traits, Pod borers
DOI: https://dx.doi.org/10.17582/journal.pjz/20200703050747
* Corresponding author: j.jagdish@cgiar.org
0030-9923/2022/0001-0405 $ 9.00/0
Copyright 2022 Zoological Society of Pakistan
INTRODUCTION
Pigeon pea (Cajanus cajan (L.) Millspaugh) is one of the major grain legume crops in the tropical and subtropical regions of the Asia and Africa and it is considered to as a second important pulse crop of India after chickpea. It is commonly known as arhar or red gram or tur in India. India is the largest producer of pigeonpea contributing > 93 % of the global production. It is grown in an area of 4.46 million hectares with production of about 4.18 million tonnes and the productivity levels range from 937 kg/ ha during 2017-18 (DAC, 2018).
Among various constraints for low productivity, the insect pests are one of the major biotic constraints for the production, especially pod borer complex which can cause an estimated annual loss of over $2 billion in the semi-arid tropics, despite application of insecticides costing over $500 million annually (Sharma, 2005). Pod borer’s causes 60 to 90 % loss in the grain yield under favourable conditions. Economic losses due to biotic factors have been estimated to be US $ 8.48 billion. The pod fly, Melanagromyza obtusa alone causes a yield loss of 60 to 80% and the losses have been estimated at US $ 256 million annually (Patange and Chiranjeevi, 2017).
Under field condition a wide range of insecticides were used for control of insect pest but due to indiscriminate use of pesticides leads to resistance build up, resurgence of pests, secondary outbreak of minor pest takes place. So keeping in view above facts adoption of host plant resistance by using tolerant cultivars or hybrids with integration of integrated pest management for sustainable production (Halder et al., 2006). Host plant resistance is association of morphological characters viz. plant height, pod length, pod width, pod wall thickness, trichome density. Biochemical traits viz. protein, sugars, phenols, tannins, flavonoids were responsible for susceptibility/resistance against pod borer complex.
MATERIALS AND METHODS
Plant material
Fifteen pigeonpea genotypes with hybrids (ICPH 3461, ICPH 2740, ICPH 3762, ICPH 4503, ICPH 2671, ICPH 2702, ICPH 3467) and cultivars (ENT 11, ICPL 87091, BDN 711, BDN 716, BSMR 853, BSMR 736) one susceptible check (ICPL 87 and resistant check ICPL 332 WR) were screened under field condition for resistance/susceptibility against pod borer complex. The seeds of hybrids, along with those of cultivated pigeonpea genotypes were sown on deep black soils (Vertisols) during the rainy season 2018-19. There were three replications for each genotype, and the genotypes in each maturity were planted in a randomized complete block design. The seeds were sown on ridges 75 cm apart, and there were four rows in each plot, 4 m long. The plants were thinned to a spacing of 30 cm between the plants 30 days after seedling emergence. Standard agronomic practices were followed for raising the crop, including application of basal fertilizer [N:P:K:100:60:40 kg ha-1] and top dressing (urea 50 ha-1). A fungicide (metalaxyl) spray (1.0 kg active ingredient (ai) ha-1) was applied to control Fusarium wilt.
Morphological parameters
Data on certain morphological traits viz. plant height, pod length, pod width and pod wall thickness were recorded for the variations in incidence of pod borer complex damage. The uniformly developed ten pods from each genotype were collected randomly and used to assess the length and width of pods with the digital vernier callipers and expressed in millimetres. The trichome density on pods and calyxes was recorded by collecting a minimum of ten uniformly developed pods and flowers, from each accession there were three replications. The material was preserved in acetic acid, absolute alcohol (2:1) and to record the trichome types and their density, the calyxes and the pods were examined under a compound microscope at a magnification of 10x under a stereomicroscope (Carl Zeiss, Inc., Thornwood, New York), with an ocular measuring grid. The number of different types of trichomes (type A, B, C, and D) and their density within the microscopic field were recorded (Shanower et al., 1997).
Assessment of pod damage
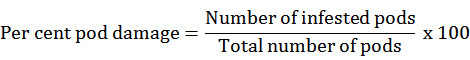
Percent pod damage and grain damage were recorded at maturity stage, pods were harvested from randomly selected five plants and pooled from that randomly 100 pods were taken randomly and examined for pod damage and grain damage and was calculated by using formula given by Gupta et al. (2018).
Biochemical composition of seeds
Biochemical parameters viz. proteins, sugar, total phenols, tannins, total flavonoids present in seeds were estimated at maturity stage. To determine the amounts of total soluble sugars, soluble proteins, condensed tannins, total flavonoids and total phenols, the seeds of each accession were collected from respective accessions, and oven dried at 55C for 3 days. The oven-dried material was powdered in a Willey mill and defatted by using hexane solution (100 ml g-1). The amounts of sugars, proteins, condensed tannins, total flavonoids and polyphenols were determined for each accession. There were three replicates for each estimation in a completely randomized design.
Estimation of proteins
Total protein was estimated by Lowry et al. (1951). 0.5 g of the seed sample was ground with a suitable solvent buffer in a pestle and mortar and centrifuged at 10,000 rpm for 20 min. The supernatant was used for estimation of protines and expressed in mg/g.
Estimation of sugars
Sugars were estimated by method given by Hedge and Hofreiter (1962). 100mg sample was hydrolyze by keeping it in a boiling water bath for 3 h with 5ml of HCl and neutralized it with sodium carbonate until the effervescence ceaseds. The volume was made up to 100ml and centrifuged to collect the supernatant for estimation of sugars expressed in mg/gm.
Estimation of total phenols
Total phenols were determined by the method of Bray and Thorpe (1954). 0.5 g of the sample was griound with 80% ethanol in a pestle and mortar and centrifuged at 10,000 rpm for 20 min for 5 times. The supernatant was evaporated to dryness, dissolved in water (5ml) for estimation of phenols expressed in mg/gm.
Estimation of tannins
Tannins were estimated by vanillin-hydrochloric acid method (Price et al., 1978) for which 0.5 g of the sample was hemogenized in methanol in a pestle and mortar and centrifuged at 10,000 rpm. For estimation of tannins expressed in mg/gm.
Estimation of total flavonoids
Total flavonoids were determined by vanillin reagent method (Swain and Hillis, 1959) for which 0.5g sample was hemogenized in ethanol and centrifuged at 10000 rpm for 20 min. The supernatant was evaporated to dryness, and dissolved in water (5ml), and used for estimation of flavonoids expressed in mg/g.
Statistical analysis
The data was statistically analyzed by standard analysis of variance in GENSTAT software version 14. Simple correlation was worked out between morphological parameters and biochemical parameters with percent pod damage.
RESULTS AND DISCUSSION
Morphological traits
Morphological traits viz., plant height, pod length, pod width, pod wall thickness showed significant variation among the genotypes (Table I). The genotype ICPL-332 WR recorded maximum plant height of 169.00 cm, whereas, ICPL-87 recorded 78.11 cm, pod length and the pod wall thickness was maximum in ENT-11 (88.97 mm, 0.69mm, respectively), whereas, pod width was highest in BSMR-853 (11.17 mm).
Table I. Plant height, pod length, pod width and pod wall thickness of different pigeonpea genotypes screened against pod borer complex during kharif 2018-19.
|
S. No. |
Genotypes |
Morphological parameters |
|||
|
plant height (cm) |
Pod length (mm) |
pod width (mm) |
pod wall thickness (mm) |
||
|
1 |
ICPL-87 (S) |
78.11 |
67.15 |
8.89 |
0.41 |
|
2 |
ICPL-322 WR (R) |
169.00 |
59.33 |
8.57 |
0.44 |
|
3 |
ENT-11 |
124.22 |
88.97 |
10.57 |
0.69 |
|
4 |
ICPL-87091 |
86.67 |
75.38 |
11.01 |
0.47 |
|
5 |
ICPH-4503 |
136.11 |
65.25 |
9.71 |
0.50 |
|
6 |
ICPH-3461 |
150.89 |
60.11 |
9.13 |
0.56 |
|
7 |
ICPH-2740 |
153.67 |
61.12 |
8.21 |
0.51 |
|
8 |
ICPH-3762 |
156.22 |
56.93 |
9.51 |
0.61 |
|
9 |
ICPH-2671 |
137.11 |
63.57 |
9.71 |
0.42 |
|
10 |
ICPH-2702 |
136.89 |
62.79 |
8.25 |
0.44 |
|
11 |
ICPH-3467 |
154.33 |
58.61 |
7.12 |
0.49 |
|
12 |
BSMR-736 |
146.56 |
60.71 |
10.04 |
0.48 |
|
13 |
BDN-716 |
143.00 |
59.53 |
9.79 |
0.58 |
|
14 |
BDN-711 |
126.67 |
62.10 |
10.41 |
0.64 |
|
15 |
BSMR-853 |
138.00 |
59.35 |
11.17 |
0.57 |
|
SE. m (±) |
1.64 |
0.79 |
0.12 |
0.02 |
|
|
CD(5%) |
4.75 |
2.25 |
0.34 |
0.03 |
|
|
CV% |
2.09 |
2.46 |
2.5 |
4.6 |
|
R, resistant check; S, susceptible check.
Significant differences were observed on trichome density of type A and B (glandular) on calyx (Table II). The highest trichome density was observed in ICPH-3467 (24.50), ICPL-87 (15.39), whereas on pods (Table III) it was maximum in ICPL-87 (12.89, 7.94). Significant variation was also observed in trichome density of type C and D (Tables II and III). Data revealed that maximum density of type C on calyx was highest in BSMR-853 (173.61) and lowest density was observed in ICPL-87 (38.39), whereas on pods it was maximum in ICPH-3461 (146.06). Type D trichome density (Tables II and III) revealed significant differences among the genotypes tested, it showed that trrichome density of type D was maximum in ICPH-3461 (63.56 ,24.83) was maximum in both calyx and pods.
Table II. Different types of trichomes and their density on calyx of different pigeonpea genotypes.
|
S. No. |
Genotypes |
Trichomes on calyx/10x microscopic field |
|||
|
Trichome A |
Trichome B |
Trichome C |
Trichome D |
||
|
1 |
ICPL 87 (S) |
15.25 c |
15.39 a |
38.39 i |
10.97 i |
|
2 |
ICPL 332 WR (R) |
8.70 ef |
1.75 hi |
142.34 c |
32.87 d |
|
3 |
ENT 11 |
6.07 g |
2.33 fgh |
124.82 e |
29.00 e |
|
4 |
ICPL 87091 |
25.55 a |
8.13 c |
81.00 h |
16.78 h |
|
5 |
ICPH 4503 |
8.67 ef |
2.93 efg |
96.37 g |
17.18 h |
|
6 |
ICPH 3461 |
12.67 d |
1.35 i |
169.81 a |
63.56 a |
|
7 |
ICPH 2740 |
7.55 fg |
3.05 ef |
106.27 f |
41.60 b |
|
8 |
ICPH 3762 |
16.39 c |
7.50 c |
154.20 b |
36.13 c |
|
9 |
ICPH 2671 |
21.11 b |
7.49 c |
124.94 e |
24.92 f |
|
10 |
ICPH 2702 |
16.83 c |
2.24 fghi |
93.35 g |
20.00 g |
|
11 |
ICPH 3467 |
24.50 a |
3.77 de |
142.51 c |
34.94 cd |
|
12 |
BSMR 736 |
12.72 d |
11.67 b |
134.61 d |
20.44 g |
|
13 |
BDN 716 |
9.78 ef |
8.17 c |
155.64 b |
21.72 g |
|
14 |
BDN 711 |
14.99 c |
4.11 d |
130.50 de |
19.72 g |
|
15 |
BSMR 853 |
6.11 g |
2.11 ghi |
173.61 a |
29.02 e |
|
SE. m (±) |
0.70 |
0.29 |
2.17 |
0.82 |
|
|
CD (5%) |
2.03 |
0.84 |
6.28 |
2.39 |
|
|
CV (%) |
8.80 |
9.17 |
3.01 |
5.12 |
|
Cd, critical difference at 5%; Cv, critical value; R, resistant check; S, susceptible check; SE.m, standard error of mean. The values followed by same alphabet did not differ significantly at P ≤ 0.05 (DMRT).
Studies revealed that plant height, pod length, pod width showed no significant role for resistance/susceptibility towards pod borer complex, whereas, pod wall thickness showed significant negative correlation (Table VI) with (r) value being -0.580** against damage caused by pod borer complex, Similarly trichome density of type C and D on calyx and pods exhibited strong negative correlation (Table VI) against pod damage by pod borer complex with correlation coefficient (r) being (-0.717**, -0.748**), (-0.810**, -0.749**), respectively. The results were in agreement with Rana et al. (2017), Kumar et al. (2015), Shanower et al. (1997), Romeis et al. (1999), Halder et al. (2006), Sunitha et al. (2008) who reported that maximum pod width and pod wall thickness offered resistance against pod borer, similarly higher density of type C and D (non glandular trichomes) showed negative association with pod damage. Whereas, type A and B (glandular trichomes) showed positive association with pod damage by pod borers.
Table III. Different types of trichomes and their density on pods of different pigeonpea genotypes.
|
S. No. |
Genotypes |
Trichomes on pod/10x microscopic field |
|||
|
Trichome A |
Trichome B |
Trichome C |
Trichome D |
||
|
1 |
ICPL 87 (S) |
12.89 a |
7.94 a |
61.11 h |
12.39 de |
|
2 |
ICPL 322 WR (R) |
7.22 de |
1.78 fg |
136.78 b |
23.78 a |
|
3 |
ENT 11 |
8.00 cd |
1.94 f |
92.00 e |
16.33 c |
|
4 |
ICPL 87091 |
12.83 a |
5.61 c |
75.67 g |
10.22 fg |
|
5 |
ICPH 4503 |
5.72 f |
6.06 b |
84.22 f |
8.00 h |
|
6 |
ICPH 3461 |
8.56 c |
1.83 fg |
146.06 a |
24.83 a |
|
7 |
ICPH 2740 |
5.22 f |
3.28 d |
89.83 ef |
12.28 de |
|
8 |
ICPH 3762 |
6.17 ef |
2.00 f |
132.50 b |
19.00 b |
|
9 |
ICPH 2671 |
12.00 a |
7.61 a |
86.33 ef |
11.33 ef |
|
10 |
ICPH 2702 |
10.83 b |
2.83 e |
98.61 d |
8.22 h |
|
11 |
ICPH 3467 |
6.22 ef |
3.28 d |
100.39 d |
8.89 gh |
|
12 |
BSMR 736 |
7.56 cd |
1.94 f |
86.44 ef |
4.89 i |
|
13 |
BDN 716 |
7.78 cd |
1.50 g |
122.22 c |
5.22 i |
|
14 |
BDN 711 |
8.56 c |
3.50 d |
84.12 f |
13.33 d |
|
15 |
BSMR 853 |
3.06 g |
1.78 fg |
125.21 c |
17.28 c |
|
SE.m (±) |
0.36 |
0.12 |
1.91 |
0.49 |
|
|
CD (5%) |
1.04 |
0.36 |
5.52 |
1.42 |
|
|
CV (%) |
7.63 |
6.08 |
3.25 |
6.50 |
|
R, resistant check; S, susceptible check. For abbreviations and statistical details see Table II.
Pod damage to pigeonpea genotypes due to pod borer complex
Overall pod damage by pod borer complex was observed in the range 17.64 to 64.04 %. The genotype ICPH 3461 (17.64 %) was least preferred by pod borer complex (Table IV). Whereas, susceptible check ICPL 87 (33.16 %) was highly prone to pod damage.
The results were in tune with Chakravarthy et al. (2016) who screened 10 promising genotypes against pod borer complex. The percent pod damage by lepidopteran borers varied significantly and ranged from 11.82 % to 21.03 % as compared to 16.98% and 15.99 % on checks, Manak and UPAS120. The pod damage due to pod fly ranged from 6.79 % to 15.42 % as compared to 13.29 % and 11.74 % on check Manak and UPAS120.
Protein
Significant differences were observed in protein content of 15 pigeonpea genotypes. The protein content was observed in the range of 174.35 mg/g to 65.76 mg/g (Table V). The highest protein content was estimated from ICPH 2671(174.35 mg/g) and the least in ICPH 3762 (65.76 mg/g). Correlation studies revealed significantly highly positive correlation between protein with percent pod damage by pod borer complex (r = 0.710**) (Table VI). It clearly explains that high protein content was responsible for pest susceptibility. The results of present investigation are in conformity with the findings of Sunitha et al. (2008) who also observed similar trend that protein content in pods was significantly higher (25.5%) in susceptible ICPL 88034 when compared with resistant ICPL 98003 (16.5%) against the M. virata in short duration pigeonpea cultivars.
Sugars
Sugar content in pigeonpea genotypes ranged from 45.09 mg/g to 100.60 mg/g (Table V). The maximum sugar content was measured in BSMR 736 (100.60 mg/g), and lowest in BSMR 853 (45.09 mg/g). Total soluble sugars also exhibited highly significant positive correlation with percent pod damage by pod borer complex with correlation coefficient (r = 0.843**), respectively (Table VI). It clearly shows genotypes with high sugar content offered susceptibility to pod borer complex. The result were similar to Sai et al., (2018) who reported sugars present in pod walls exhibit a strong correlation with correlation coefficient (r) 0.642, against pod damage due to M. vitrata.
Total phenols
The phenol content was showed significant variation among different genotypes. It was ranged from 61.67 mg/g to 12.80 mg/g (Table V). The highest phenol content was measured in ICPH 3461 (61.67 mg/g), followed by resistant check ICPL 332 WR (59.17 mg/g). Lowest phenolic content was observed in ICPH-4503 (12.80 mg/g). Correlation studies between phenolic content and pod damage by pod borer complex showed highly significant negative association with r value (-0.729**) which clearly shows that high phenol content exhibit critical role in offering resistance to pod borers in field
Table IV. Pod damage by pod borer complex on different pigeonpea genotypes.
|
S. No. |
Genotypes |
Pod damage by pod borers (%) |
Pod damage by pod fly (%) |
Overall pod damage by pod borer complex (%) |
|
1 |
ICPL 87 (S) |
30.88i (33.76) |
33.16i (35.16) |
64.04f (53.15) |
|
2 |
ICPL 322 WR (R) |
10.71abc (19.10) |
14.60abc (22.46) |
25.31ab (30.20) |
|
3 |
ENT 11 |
15.72cde (23.36) |
17.00bcd (24.35) |
32.72bc (34.89) |
|
4 |
ICPL 87091 |
28.97hi (32.56) |
32.04hi (34.47) |
61.01f (51.36) |
|
5 |
ICPH 4503 |
18.54de (25.50) |
22.74def (28.48) |
41.28cde (39.98) |
|
6 |
ICPH 3461 |
8.26a (16.70) |
9.38a (17.83) |
17.64a (24.83) |
|
7 |
ICPH 2740 |
14.34bcd (22.25) |
18.80cde (25.70) |
33.14bcd (35.15) |
|
8 |
ICPH 3762 |
9.47ab (17.92) |
15.17bc (22.92) |
24.63ab (29.76) |
|
9 |
ICPH 2671 |
27.76ghi (31.79) |
31.05hi (33.86) |
58.81f (50.07) |
|
10 |
ICPH 2702 |
27.55ghi (31.66) |
30.57ghi (33.56) |
58.12f (49.67) |
|
11 |
ICPH 3467 |
21.82efgh (27.85) |
24.72efgh (29.81) |
46.54e (43.01) |
|
12 |
BSMR 736 |
26.98fghi (31.29) |
29.86fghi (33.12) |
56.84f (48.93) |
|
13 |
BDN 716 |
20.70defg (27.06) |
21.99de (27.97) |
42.69cde (40.79) |
|
14 |
BDN 711 |
19.98def (27.06) |
23.31defg (28.87) |
43.28de (41.14) |
|
15 |
BSMR 853 |
11.68abc (19.98) |
11.56ab (19.88) |
23.24a (28.82) |
|
|
SE.m ± |
1.55 |
1.53 |
1.93 |
|
|
LSD (5%) |
4.48 |
4.42 |
5.60 |
|
|
CV (%) |
10.40 |
9.50 |
8.35 |
Figures in parentheses are angular transformed values. For abbreviations and statistical details see Table II.
Table V. Biochemical profile of different pigeonpea genotypes.
|
S. No |
Genotypes |
Protein (mg/g) |
sugars (mg/g) |
Total phenols (mg/g) |
Tanins (mg/g) |
flavonoids (mg/g) |
|
1 |
ICPL 87 (S) |
161.70 b |
100.27 a |
34.86 f |
3.15 g |
1.62 hi |
|
2 |
ICPL 332 WR (R) |
70.59 k |
59.09 g |
59.17 b |
12.20 a |
3.63 b |
|
3 |
ENT 11 |
122.94 g |
68.30 f |
46.21 c |
5.60 e |
2.17 g |
|
4 |
ICPL 87091 |
154.24 c |
81.90 d |
15.57 k |
5.60 e |
1.50 i |
|
5 |
ICPH 4503 |
133.65 f |
75.50 e |
12.80 l |
5.45 ef |
1.68 h |
|
6 |
ICPH 3461 |
100.00 i |
62.09 g |
61.67 a |
7.90 c |
4.59 a |
|
7 |
ICPH 2740 |
125.20 e |
82.60 d |
42.53 d |
8.40 c |
3.21 d |
|
8 |
ICPH 3762 |
65.76 l |
59.00 g |
34.30 fg |
9.75 b |
3.59 b |
|
9 |
ICPH 2671 |
174.35 a |
96.23 b |
16.10 k |
6.65 d |
2.11 g |
|
10 |
ICPH 2702 |
141.53 e |
90.90 c |
20.57 j |
6.50 d |
2.63 e |
|
11 |
ICPH 3467 |
150.82 d |
79.20 de |
23.43 i |
7.05 d |
3.10 d |
|
12 |
BSMR 736 |
149.30 d |
100.60 a |
32.90 g |
6.60 d |
1.16 j |
|
13 |
BDN 716 |
84.12 j |
58.32 g |
38.57 e |
8.05c |
3.36 c |
|
14 |
BDN 711 |
114.59 h |
68.82 f |
30.03 h |
4.70 f |
2.47 f |
|
15 |
BSMR 853 |
144.47 e |
45.09 h |
42.87 d |
7.90 c |
3.13 d |
|
SE.m ± |
1.12 |
1.28 |
0.51 |
0.27 |
0.05 |
|
|
CD (5%) |
3.23 |
3.71 |
1.46 |
0.83 |
0.13 |
|
|
CV (%) |
1.53 |
2.96 |
2.57 |
6.8 |
2.96 |
|
R, resistant check; S, susceptible check. For abbreviations and statistical details see Table II.
condition (Table VI). The results were similar to Cheboi et al. (2019) who reported significant negative correlation was also observed between total phenol with pod damage with correlation coefficient (r) -0.923**.
Tannins
Significant difference was observed in different pigeonpea genoptypes with respect to tannin content (Table V). The tannin content was ranged from 3.15 mg/g to 12.20 mg/g. The highest tannin content was recorded in resistant check ICPL 332 WR (12.20 mg/g), and least was measured in ICPL 87 (3.15 mg/g). The correlation between tannin content of genotypes and pod damage by pod borer complex showed significant negative association (r= -0.650**), respectively, which clearly shows genotypes with high tannin content offered resistance against pod borer complex. The results were in accordance with the results were in tune with Jat et al. (2018) who reported the tannin content in pod walls exhibited negative correlation with H. armigera, M.virata, M. obtuse pod damage with correlation coefficient (r) -0.812*, -0.411, -0.763*, respectively.
Authors thank entomology staff of ICRISAT for their support while conducting the experiments.
Table VI. Correlation of morphological and biochemical traits with percent pod damage by pod borers and pod fly.
|
S. No. |
Parameters |
Pod borers |
Pod fly |
Pod borer complex |
|
1 |
Plant height |
-0.644** |
-0.589* |
-0.619* |
|
2 |
Pod length |
0.225 |
0.175 |
0.201 |
|
3 |
Pod width |
-0.046 |
-0.069 |
-0.036 |
|
4 |
Pod wall Thickness |
-0.560* |
-0.594* |
-0.580* |
|
5 |
Trichome A on calyx |
0.568* |
0.607* |
0.590* |
|
6 |
Trichome B on calyx |
0.644** |
0.648** |
0.649** |
|
7 |
Trichome C on calyx |
-0.695** |
-0.731** |
-0.717** |
|
8 |
Trichome D on calyx |
-0.744** |
-0.744** |
-0.748** |
|
9 |
Trichome A on Pods |
0.724** |
0.714** |
0.722** |
|
10 |
Trichome B on Pods |
0.641* |
0.671** |
0.659** |
|
11 |
Trichome C on Pods |
-0.799** |
-0.813** |
-0.810** |
|
12 |
Trichome D on Pods |
-0.747** |
-0.745** |
-0.749** |
|
13 |
Proteins |
0.735** |
0.679** |
0.710** |
|
14 |
Sugars |
0.821** |
0.857** |
0.843** |
|
15 |
Total phenols |
-0.700** |
-0.751** |
-0.729** |
|
16 |
Tannins |
-0.675** |
-0.619** |
-0.650** |
|
17 |
Flavonoids |
-0.778** |
-0.781** |
-0.783** |
Statement of conflict of interest
The authors have declared no conflict of interest.
REFERENCES
Bray, H.G. and Thorpe, W.V., 1954. Analysis of phenolic compounds of interest in metabolism. Methods Biochem. Anal., 1: 27-52. https://doi.org/10.1002/9780470110171.ch2
Cheboi, J.J., Kimurto, P.K. and Kinyua, M.G., 2019. Variability in morpho-biochemical traits associated with pod borer (Helicoverpa armigera) resistance in pigeonpea pods. J. exp. Agric. Int., 31: 1-7. https://doi.org/10.9734/jeai/2019/v31i330073
Chakravarty, S., Bera, T., Agnihotri, M. and Jaba, J., 2016. Screening of short duration pigeonpea [Cajanus cajan (L.) Millsp.] genotypes against major insect pests. J. Pure Appl. Microbiol., 10: 3009-3016. https://doi.org/10.22207/JPAM.10.4.71
DAC, 2018. Annual report on commodity profile for pulses, December.
Gupta, S., Rana, N. and Bhagat, J., 2018. Screening of pigeonpea germplasms against the pod borer complex over a period of two years under field conditions. J. Pharmacogn. Phytochem., 7: 2402-2405.
Halder, J., Srinivasan, S. and Muralikrishna, T., 2006. Role of various biophysical factors on distribution and abundance of spotted pod borer, Maruca vitrata (Geyer) in mung bean. Annls Pl. Prot. Sci., 14: 49-51.
Hedge, J.E. and Hofreiter, B.T., 1962. Carbohydrate chemistry 17 (eds. R.L. Whistler and J.N. Be Miller), Academic Press, New York.
Jat, B.L., Dahiya, K.K., Harish, K. and Mandana, S., 2018. Study of biophysical and structural mechanism of resistance in pigeonpea against pod borer complex. Bioscan, 13: 521-528.
Kumar, G.S., Krishna, T.M., Prasanthi, L., Sudhakar, P. and Devaki, K., 2015. Morphological and biochemical traits associated with resistance to pod fly, Melanagromyza obtusa (Malloch) in pigeonpea. Int. J. appl. Biol. Pharm. Technol., 6: 134-141.
Lowry, O.H., Rosbrough, N.J., Farr, A.L. and Randall, R.J., 1951. Protein measurement with the folin ohenol reagent. J. biol. Chem., 193: 265-275.
Moudgal, R.K., Lakra, R.K., Dahiya, B. and Dhillon, M.K., 2008. Physico-chemical traits of pigeonpea pod wall affecting Melanagromyza obtuse (Malloch) damage. Euphytica, 161: 429-436. https://doi.org/10.1007/s10681-007-9601-5
Patange, N.R. and Chiranjeevi, B., 2017. Bioefficacy of newer insecticides against pigeonpea (Cajanus cajan L. Millsp.) pod borers. J. Ent. Zool. Stud., 5: 28-31.
Price, M.L., Van Scoyoc, S. and Butler, L.G., 1978. A Critical evaluation of the vanillin reaction as an assay for tannin in sorghum grain. J. Agric. Fd. Chem., 26: 1214-1218. https://doi.org/10.1021/jf60219a031
Rana, N., Jayalaxmi, G., Agale, S. and Joshi, B., 2017. Role of morphological characters offering resistance/susceptibility of pigeonpea genotypes to pod borer complex. Agric. Update, 12: 641-647. https://doi.org/10.15740/HAS/AU/12.TECHSEAR(3)2017/641-647
Romies, J., Shanower, T.G. and Peter, A.J., 1999. Trichomes on pigeon pea. Crop Sci., 39: 564-569. https://doi.org/10.2135/cropsci1999.0011183X003900020043x
Sai, Y., Sreekanth, M., Sairam K.D.V. and Manoj K.V., 2018. Morphological and biochemical factors associated with resistance to Helicoverpa armigera (Hubner) and Maruca vitrata (Geyer) in pigeonpea. J. Ent. Zool. Stud., 6: 3073-3078.
Shanower, T.G., Romeis, J.E. and Minja, M., 1999. Insect pests of pigeonpea and their management. Annu. Rev. Ent., 44: 77-96. https://doi.org/10.1146/annurev.ento.44.1.77
Shanower, T.G., Yoshida, M. and Peter, A.J., 1997. Survival, growth, fecundity and behaviour of Helicoverpa armigera (Lepidoptera: Noctuidae) on pigeonpea and two wild Cajanus species. J. econ. Ent., 90: 837-841. https://doi.org/10.1093/jee/90.3.837
Sharma, H.C., and Stevenson, P.C. and Gowda, C.L.L., 2005. Helicoverpa management emerging trends and strategies for future research. Oxford and IBH Publishers, New Delhi, India. pp. 469. https://doi.org/10.1201/9781482280340
Sunitha, V., Vijaya Lakshmi, K. and Ranga R.G.V., 2008. Screening of pigeonpea genotypes against Maruca vitrata (Geyer). J. Fd. Legumes, 21: 193-195.
Sunitha, V., Ranga Rao, G.V., Lakshmi, V.V., Saxena, K.B., Rameshwar Rao, V. and Reddy, Y.V.R., 2008. Morphological and biochemical factors associated with resistance to Maruca vitrata (Lepidoptera: Pyralidae) in short-duration pigeonpea. Int. J. trop. Insect Sci., 28: 45-52. https://doi.org/10.1017/S1742758408959646
Swain, T. and Hillis, W.E., 1959. Phenolic constituents of Prunus domestica I, The quantitative analysis of phenolic constituents. J. Sci. Fd. Agric., 10: 63–68. https://doi.org/10.1002/jsfa.2740100110
To share on other social networks, click on any share button. What are these?