
Optimization of IBA Concentration for Rapid Initiation of Roots and Ultimate Growth of Kiwi Seedlings and the Association between Root System Architecture and Seedlings Growth


Optimization of IBA Concentration for Rapid Initiation of Roots and Ultimate Growth of Kiwi Seedlings and the Association between Root System Architecture and Seedlings Growth
Noorullah Khan1*, Farrukh Siyar Hamid1, Fayaz Ahmad1, Sabaz Ali Khan2, Imtiaz Ahmed1, Muhammad Abbas Khan1, Shamsul Islam1, Abdul Waheed1, Basharat Hussain Shah1 and Hussain Shah3

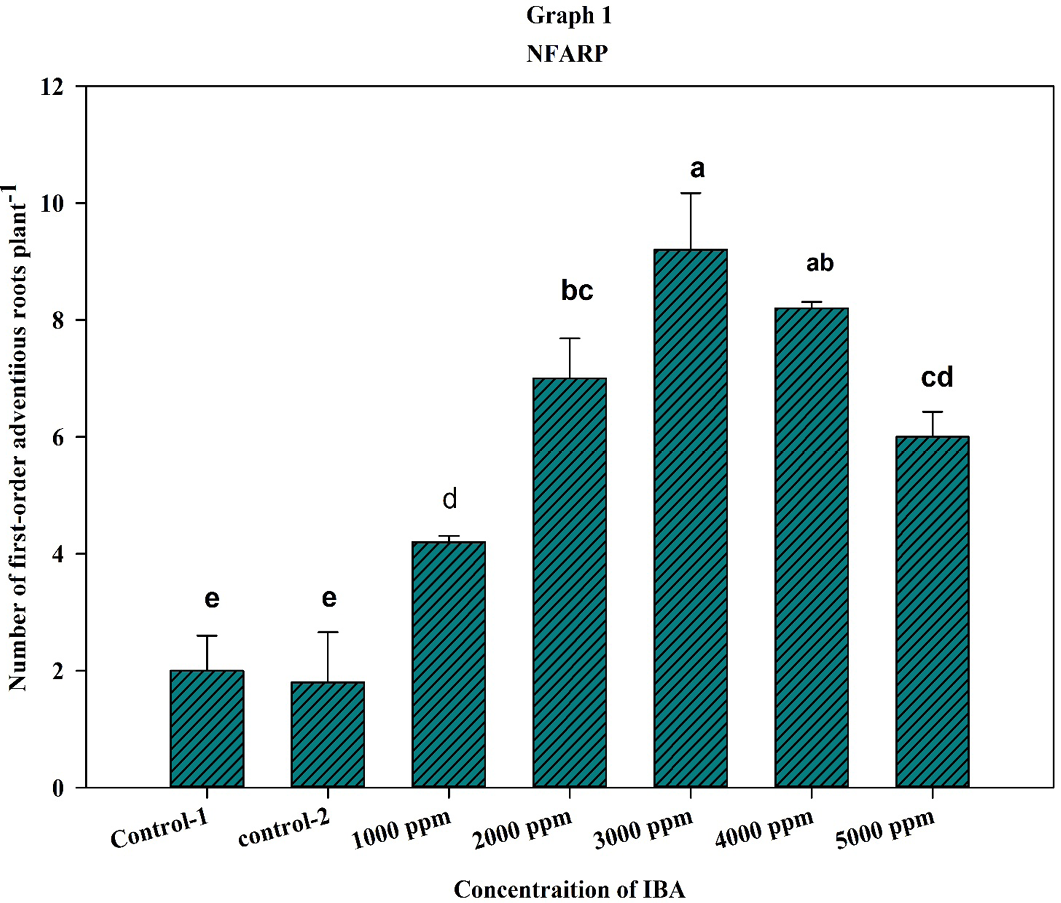
Number of First-order adventitious roots plant-1 (NFARP) as affected by different concentrations of IBA; The data for NFARP were statistically highly significant according to analysis of variance Table 1. Means with different alphabetic letters indicate statistically significant differences according to Least Significant Differences (LSD) test (P< 0.05).
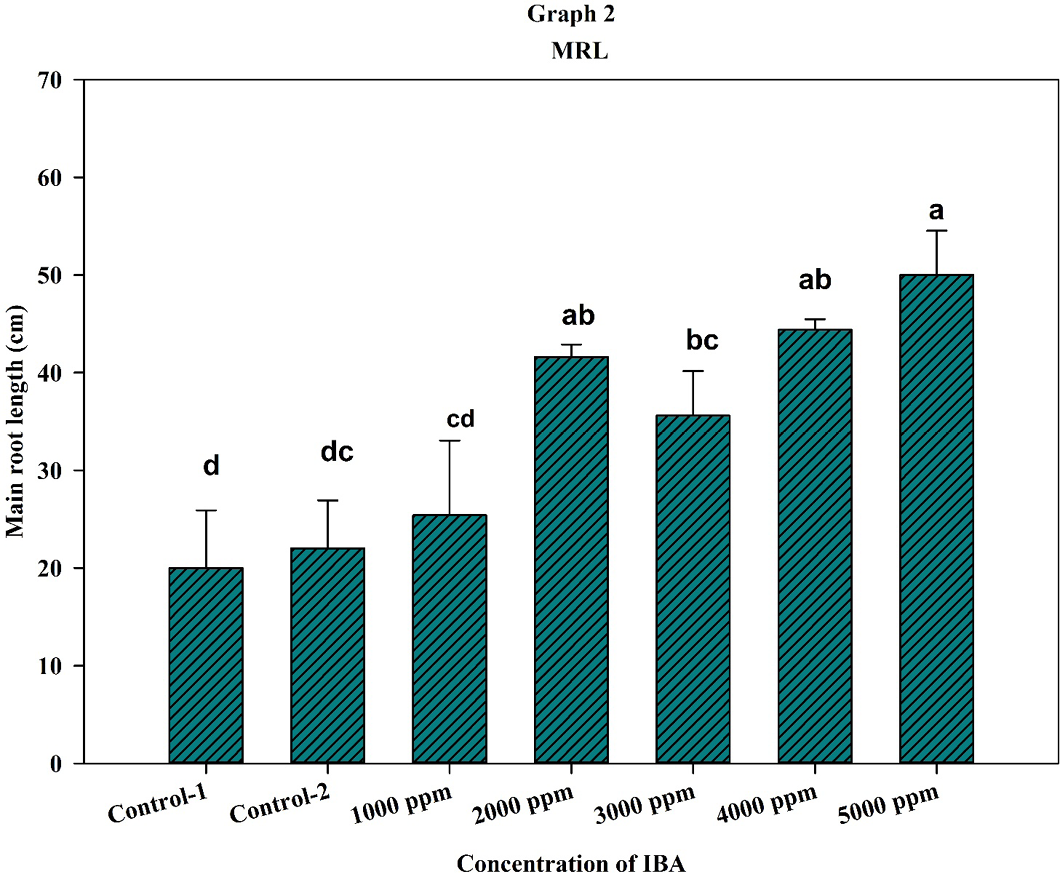
Main Roots Length (MRL cm) as affected by different concentrations of IBA; The data for MRL were statistically significant according to analysis of variance (P< 0.001) Table 1. Means with different alphabetic letters indicate statistically significant differences according to Least Significant Differences (LSD) test (P< 0.05).

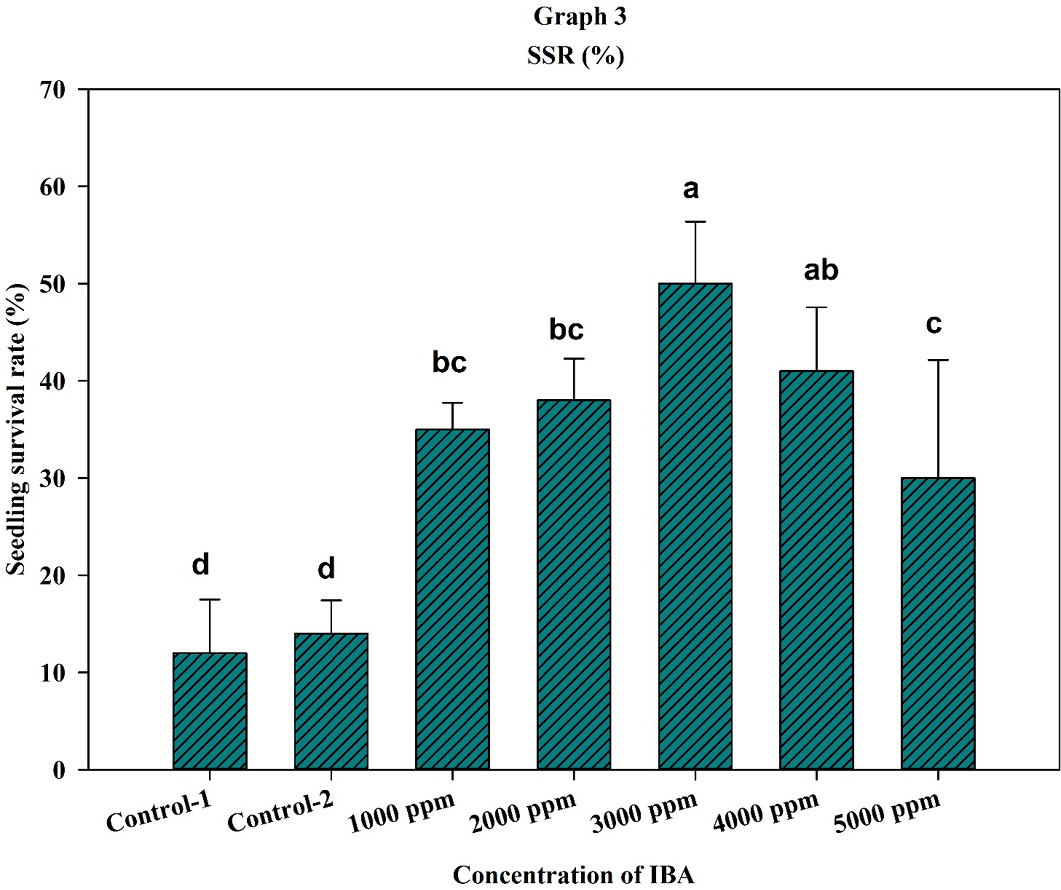
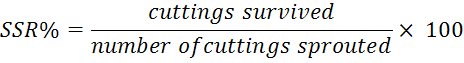
Seedlings Survival Rate (SSR %) as affected by different concentrations of IBA; The data for SSR% were statistically highly significant according to analysis of variance (P< 0.0001) Table 1. Means with different alphabetic letters indicate statistically significant differences according to Least Significant Differences (LSD) test (P< 0.05).

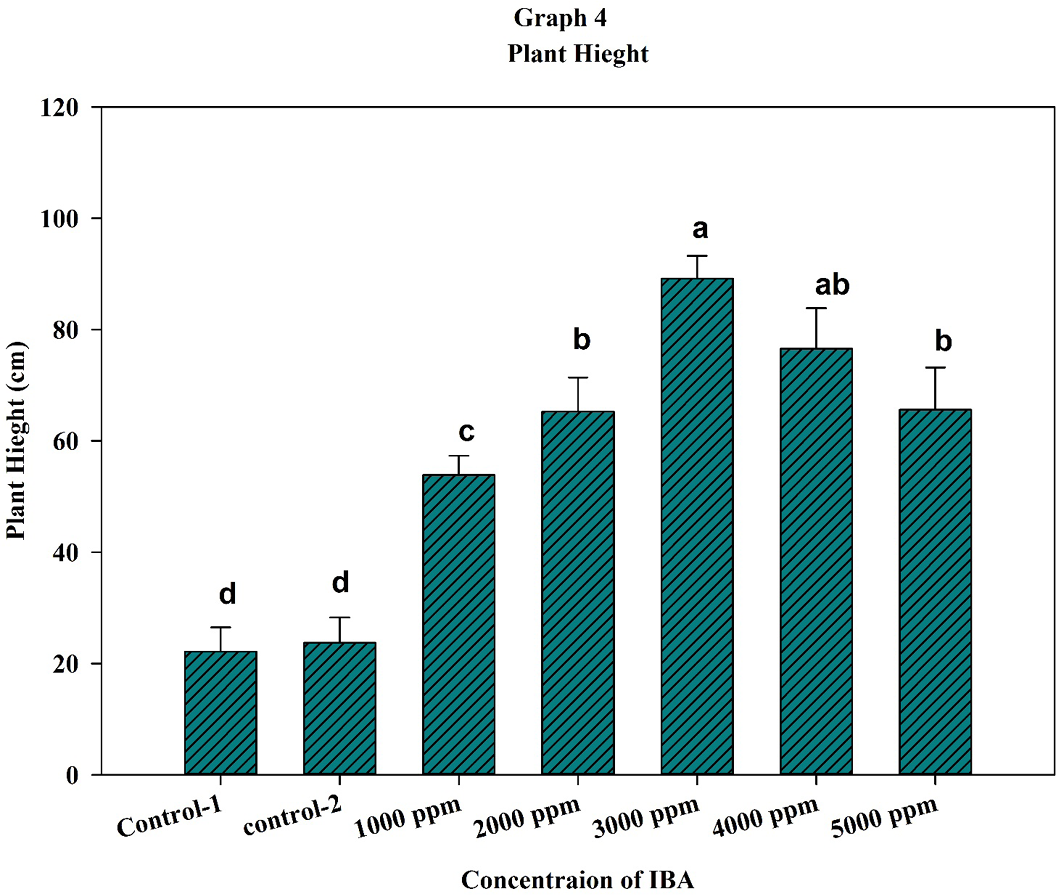
Plant Height (PH cm %) as effected by different concentrations of IBA; The data for SSR% were statistically highly significant according to analysis of variance Table 1. Means with different alphabetic letters indicate statistically significant differences according to Least Significant Differences (LSD) test (P< 0.05).

