

Production of Stable Serum Albumin Fused Streptokinase in Pichia pastoris


Production of Stable Serum Albumin Fused Streptokinase in Pichia pastoris
Saad Tahir, Nadeem Ahmed*, Mohsin Ahmad Khan, Muhammad Akram, Rabia Abbas and Kausar Malik

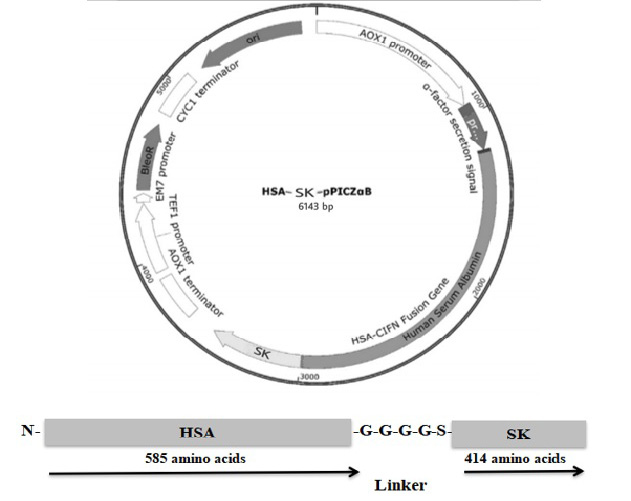
Codon optimized HSA-SK gene in pPICZαB expression cassete (B) HSA-SK fusion gene graphical demonstration.
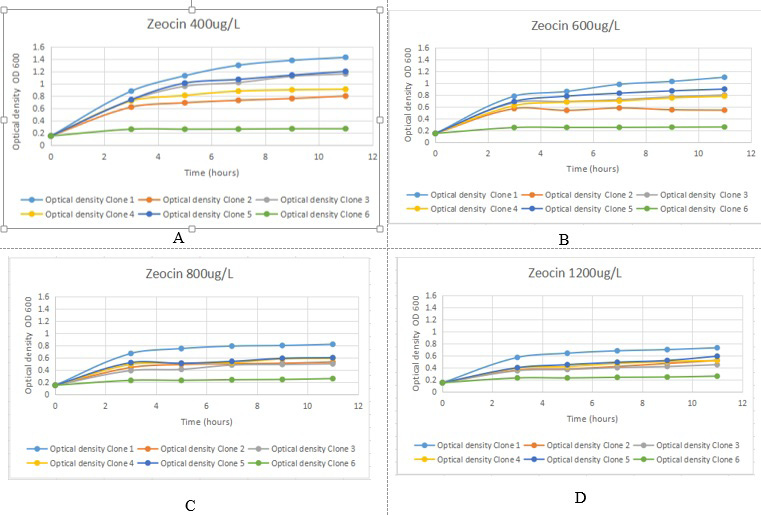
The productivity curves of transformed P. pastoris GS115 strains at different time intervals in gradually increasing Zeocin™ concentration i.e., A. 400 μg/μl B. 600 μg/μl C. 800 μg/μl and D. 1200 μg/μl concentration of Zeocin™.
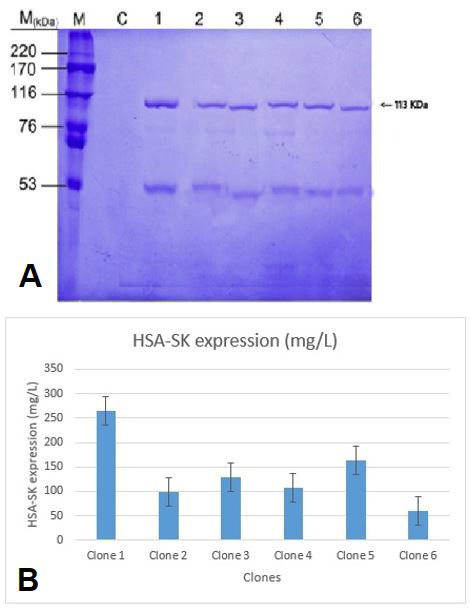
The expression analysis of six HSA-SK-pPICZαB transformant clones of P. pastoris GS115 using 10% SDS-PAGE. Lane M shows the protein marker, Lane C contain a control (P. pastoris GS115 strain transformed with a simple pPICZαB vector), and lanes 1-6 indicate HSA-SK-pPICZαB expression vector containing P. pastoris GS115 clones. The bands lie quite close to the expected HSA-SK value with clone 1 representing comparatively thicker band. B, A band intensity based estimation of HSA-SK fusion protein by analyzing the high definition image of SDS PAGE stained by CBB stain.P. pastoris clone 1 represented the highest expression level of HSA-SK gene i.e., more than 350mg/L.
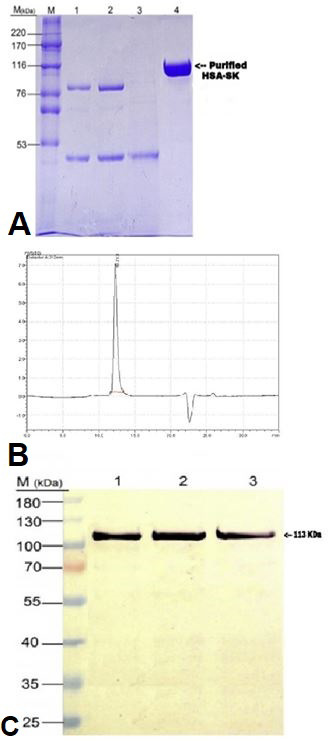
(A) SDS-PAGE analysis of purified HSA-SK as a result of one step chromatographic purification by capture select human serum albumin affinity marix. Here Lane M represents protein markers of high molecular weight, Lane 1 contain proteins from broth supernatent, Lane 2 contain protein from diafiltered supernatent, Lane 3 represents protein from flow through and finally, Lane 4 represents the final eluted fusion protein HSA-SK. (B) Chromatogram is showing the analysis of purified HSA-SK fusion protein by RP- HPLC. 210 nm detector was used for the absorbance of protein and chromatogram showed a single sharp peak at retention time 10.7 min. (C) Western blot analysis of purified fusion protein HSA-SK where Lane M contain marker protein, Lane 1 represents a band of purified HSA-SK, Lane 3 has a band of non-reduced HSA-SK and Lane 3 shows a band of HSA-SK standard.
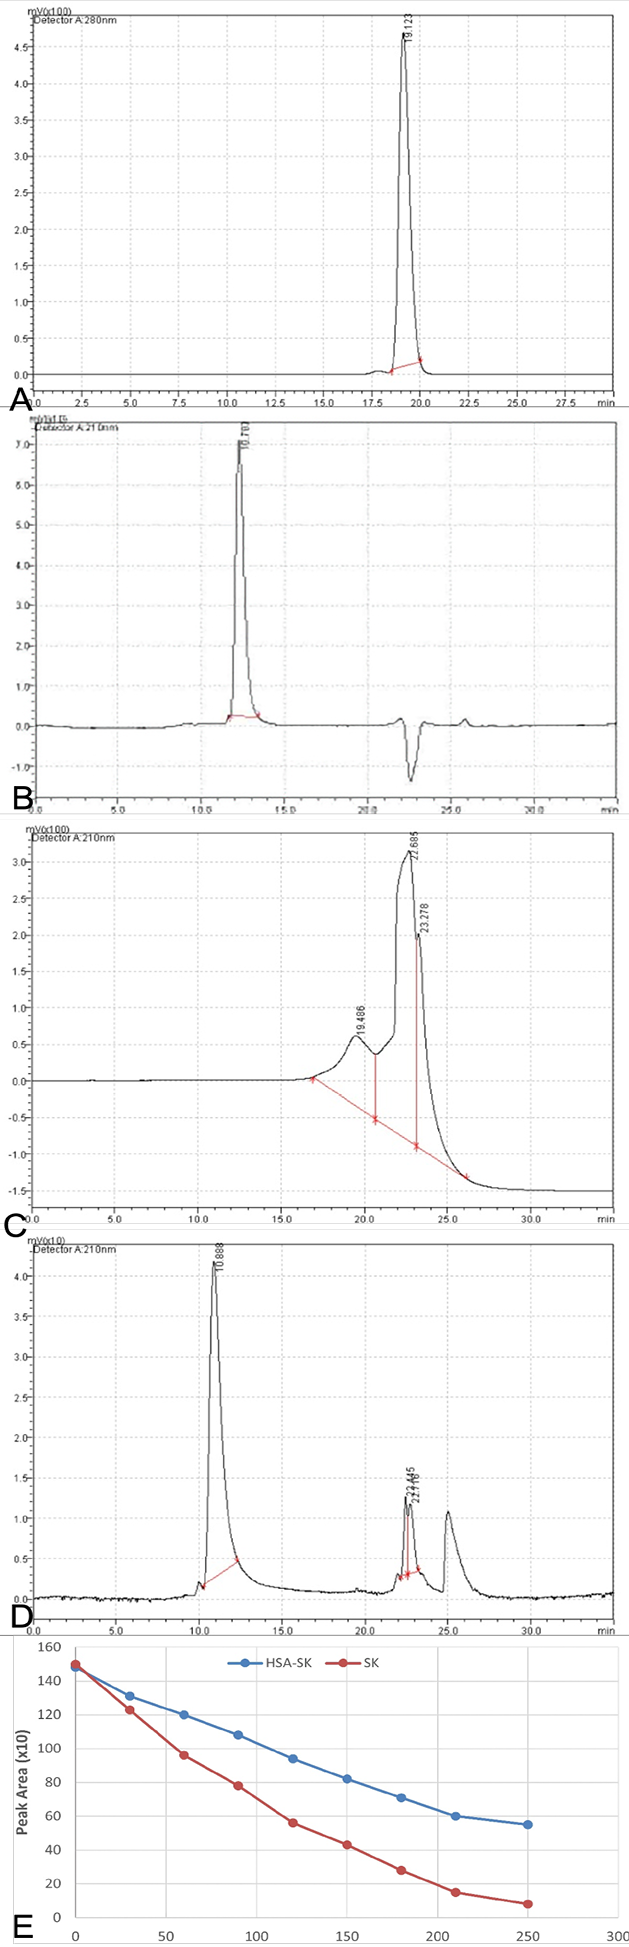

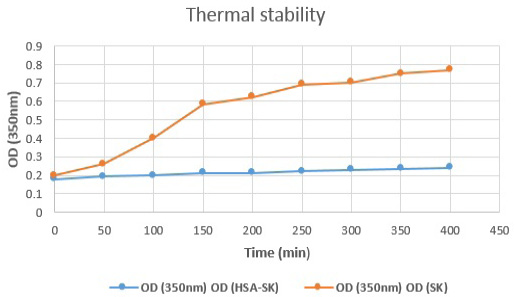
HSA-SK fusion protein thermal stability testing indicates higher stability of HSA-SK as compare to the standard SK protein.

