Quality of Acid Base Treated Wood Coal and its Effect on Soil Behavior


Research Article
Quality of Acid Base Treated Wood Coal and its Effect on Soil Behavior
Habib Ullah Khan1*, Saleem Ullah1, Hamid Ullah Shah1, Muhammad Arif2
1Department of Agricultural Chemistry, University of Agricultural Peshawar, Khyber Pakhtunkhawa, Pakistan; 2Department of Agronomy, Agricultural University Peshawar, Khyber Pakhtunkhawa, Pakistan.
Abstract | Powdered wood coal in 32 different portions (each 250g) was treated individually with solutions (1.0L each) 4% HCl andH2SO4, 15% HNO3,5%NaOH and KOH abbreviated as C, F, N,S, P and their combination i.e.CF, CN, CS, CP, FN, FS, FP, NS, NP, SP, CFN, CFS, CFP, FNS, FNP, FSP, CNS, CNP, CSP, FSP, NSP, CFNS, CFNP, CFSP, CNSP, FNSP, CFNSP. Quality of the treated wood coal and their effect on soil pH, Electrical Conductivity (EC), acidity, total nitrogen and other minerals was studied. pH and EC of the treated wood coal ranged from 1.48 to 11.9 and 3.45 to 28.4µs/dl respectively. Soil EC was lower 96.60 µS/dl in untreated soil while highest 190.10 µS/dl in NSP treated soil. Acidity of the treated soil ranged from 0.97g/L in S to 1.41 g/L in FN treated soils. The highest value (6.58x10⁻³%) of total nitrogen was in CFNSP treated soil. An increase in soil pH was noted where treatments variation ranged from 8.10 to 8.32 in CFP and CNS respectively. The effect of treatments on soil minerals in mg/kg indicated greatest variation in Fe from 2.759 to 5.358, Mn from 0.324 to 0.73, Na from.9 to 11.9 and K from 8.60 to 15.30 while other minerals like Cu, Zn, P, Pb and Ni showed moderate variability. It was concluded that acid base treatment of the wood coal resulted in pH, EC and minerals changes which might have good or bad effect on plants grown in those soils.
Received | February 29, 2016; Accepted | April 08, 2016; Published | May 30, 2017
*Correspondence | Habib Ullah Khan, Agricultural Chemistry, Pakistan; Email: habib_297@yahoo.com
Citation | Khan H.U., Saleem Ullah, H.U. Shah, M. Arif. 2017. Quality of acid base treated wood coal and its effect on soil behavior. Sarhad Journal of Agriculture, 33(2): 240-247.
DOI | http://dx.doi.org/10.17582/journal.sja/2017/33.2.240.247
Keywords | Wood coal, Dilute Acids, Dilute bases, Fertilizers, Soil
Introduction
Coal is the carbon part of dead plants and animals, which come into being mainly by two process, one is the decomposition process, where dead plants and animal residues are decomposed chemically or biological and only the carbon portion is remained (Stephen, 1994). Sometime this decomposed carbon part buried deep in the soil and the carbon looks like a stone, although it is coal or carbon part of the dead organisms (Seshadri et al., 2010). This type of coal is called mineral coal and large reserves are present in the world and also in Pakistan (Hamalainen and Aho, 1995; Bohra developers, 2015). Mineral coal is mainly used for burning purposes. However recently the coal is gasified or liquefied and are utilized as fuels in engines or used in other industries for making various chemical products (Chen et al., 2010). The fresh decomposition of dead animals and plants is called peat or manure etc. and used in fertilization of soil for crop production (Oh et al., 2014). The next process is burning of wood, grasses or dead organs of animals etc. in low oxygen environment and mainly termed as wood coal or biochar in recent scientific language. Biochar although used for burning in stoves etc. or as decolonizing agent in various industries, however recently biochar is also being utilized for soil fertilizing for crops production. Studies show that coal although not provide nutrients of their own but it can help in retention and absorption of minerals from the soil and reduce water loss from the ground surface of the field as it acts as mulch (Piccolo et al., 1993; Eyheraguibel et al., 2008). New research shows that biochar and also mineral form of coal when treated with acid and base solutions, the carbon part called humic acids are extracted which is similar to manure or any other fertilizers but contain only carbon in abundance (Akinci et al., 2009). It works the same as biochar however it provides its own carbon to the plants better than that of simple biochar. Some studies showed that biochar when treated with acids and bases, the minerals in biochar are become available to plants (Glaser et al., 2002). However very little work has been reported in this respect. The present project was design to study the effect of acid base treatment of wood coal on their physical characteristics and its effect on soil quality, nitrogen content of the soil and other minerals availability in the soil.
Materials and Methods
Wood coal, obtained from local shops was grinded into powder, using powder, using laboratory mill. The powdered coal was divided into 32 equal portions of 250g each and transferred individuallyinto the same number of graduated brown glass bottle shaving capacity of 1.5L each. Three acid solutions i.e. 4% HCl, 4% H2SO4, 15% HNO3 and two bases solutions 5% KOH and 5% of NaOH abbreviated as ‘C’, ‘F’,’N’, ‘S and ‘P’ respectively were prepared. Five of the 32 bottles were added one solution per one bottle. To the next 10 bottles two solutions per bottle in 1:1were added. The combinations were combinations were abbreviated as CF, CN, CS, CP, FN, FS, FP, NS, NP and SP. To the other 11 of the remaining bottles three solutions per bottle were added which were CFN, CFS, CFP, FNS, FNP, FSP, CNS, CNP, CSP, FSP, and NSP. Five of the remaining bottles were added four different solutions in 1:1 ratio ratio per bottle, which were CFNS, CFNP, CFSP, CNSP and FNSP. The last bottle was treated with a combination of five different solutions abbreviated as CFNSP. The bottles where combination of solutions was used, the wood coal was first treated with one solution and kept overnight then the second solution was added to avoid the salt formation of acid base solution during the treatment. The treated wood coal was applied to the same number of pot sets containing three pots per set. Each pot contained 2.5Kg of sandy loam soil. The treated wood coals were applied in diluted form (10mL of treated wood coal/100mL of distilled water) at regular interval of about 15 days each. Along the 32 sets of treated wood coal, 4pot sets were applied NPK, humic acid, wood coal, farm yard manure in their recommended amounts and one pot set was left as untreated soil. All these five treatment were used as controls during the experiment.
Quality parameters of treated wood coal
Wood coal treated with different acid and base solutions was tested for pHand EC and EC using Mc-Clean (1984) pH an EC meter (AOAC, 2000). Three points calibration method i.e. 4, 7 and 10 buffer solutions of Merck was used for pH determination. The treated wood bottle was shaken well and 25mL portion of each treatment was taken in beaker and the pH and EC of the solution was determined by inserting the pH an EC probes.
Soil Parameters
Soil was analyzed for different physical parameters like pH, acidity, electrical conductivity (EC) and chemical parameters like total nitrogen, Fe, Zn, Cu, Mn, P, Na, K, Pb and Ni and using standard methods of AOAC (2000).
Soil Total Nitrogen (STN)
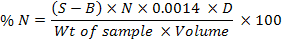
Soil total N for each treatment was determined calorimetrically, following the Kjeldhal procedure (Bremmer and Mulvaney, 1982). In this method, 0.2g of sampled soil was digested with 3mL of concentrated H2SO4 in the presence of digestion mixture containing K2Cr2O7 and Se on block digest for about 4-5 hours. The digestion was initially started at 50ºC and then the temperature was raised gradually to 100, 150. 200, 250, 300 and finally to 350oC, which was maintained maintained at least for 1 hour to turn the sample colour to light greenish or colourless. After cooling, the digest was transferred to a 100ml volumetric flask and the volume was made up with distilled water. 20ml of the digest was distilled in the presence of 5ml of 40% NaOH solution and 5mL boric acid mixed indicator. The distillate was titrated against standard 0.005M HCl, and N was calculated as 1mL of 0.005M HCl is equivalent to 70μg. A blank reading was also taken at the same time.
Mineral determination
Wet digestion method was used where 1g of soil sample was digested with HNO3 and Perchloric acids in 1:1 ratio ratio at temperature of 350oC in block digester. The digest was diluted to 100mL. For micro minerals flame atomic absorption was used and for Na, K flame photometer was used. The phosphorus was determined by UV/Vis spectrophotometer. Phosphorus standard was prepared from potassium biphosphate of Merck grade.
Soil pH, EC and acidity
Soil water suspension of 1:5 was used to measure pH of the soil with the help of pH meter (Mc-Clean, 1984). In this method, 10g soil sample and 50 mLdistilled water was shaken for 30 minutes on a reciprocal shaker. The suspensions were then analyzed for pH and EC using pH meter and EC meter after calibration the pH for different buffers. Acidity of this solution was measured by titration method. Where: 0.1 N NaOH solution was used, while Phenolphthalein was used as indicator.
Results and Discussion
pH and EC of the treated wood coal
pH of the treated wood coal (Figure 1) ranged from 1.48 to 11.9. The base treated wood coal showed basic pH i.e. higher pH. However, the pH of the acid treated wood coal or the coal portions treated with the mixture of the solutions containing acids have got acidic pH i.e. lower pH. The C treated wood coal got the lowest pH value while the highest pH was recorded for the SP treated wood coal. The EC of the wood coal treatments (Figure 2) ranged from 3.45 to 28.4µS/dl. The treatment C showed higher EC (28.4µs/dl) followed by the EC (27.6 µs/dl) of CN and CFN (22.8µs/dl) treated wood coal. The lowest EC (3.45 µs/dl) was recorded for the treatment of CSP. Electrical conductivity (EC) indicates the presence of electrolytes, i.e. salts in solution, high EC is a sign of higher ionic concentration i.e. salts in the solutions (Adviento-Borbe et al., 2006; Patriquin et al., 1993). The data showed that the wood coal treated with acids solutions might contain high dissolved salts (Smith and Doran, 1996). The change in pH values of the treatments was obvious, because the bases have higher pH and the product might have higher pH values i.e. basic pH. Similarly, the products containing acids should be of acidic pH (Sarah et al., 2011). The salt mineralization i.e. change in EC depends on the acid concentration and pH of the solution (Davidsson et al., 2002). Vaccaro (2010) also studied that the mineral leaching from the coal product depended on the strength of acid or base solution. Mineral leaching from coal was also mentioned by Ishaq et al. (2002) who studied that acids and base solution leached various minerals from coal in considerable amount.
EC, acidity and total nitrogen of soil
Electrical conductivity (EC), acidity and total nitrogen of soil after last application of the treated wood coal along with control treatments were presented in Figure 3, 4 and 5 respectively. EC of the wood coal treated soil and controls applied soils ranged from 96.60 to 190.10 µS/dl. The EC values among different treatments (products and control treated soils) varied significantly (P<0.05). The data showed that the lowest EC value (96.60 µS/dl) was recorded for untreated soil (control) and the highest value (190.10 µS/dl) was observed for NSP treated soil. The next higher value (175.70µS/dl) was recorded in soil treated with CNP treated wood coal. The coal. The soil EC is related to soil porosity, cations exchange capacity, salinity and the presence of clay amount (Robert et al., 2009). The map of soil EC after product application showed that it enhanced the Soil EC, which might improve the soil porosity or cations exchange capacity as compare to control (Anderson et al., 2002). This might be due to the presence of humic acids in the products and also of certain minerals (Singh, et al., 2008).
Acidity of soil showed a range of 0.97x10⁻² to 1.4x10⁻²g/L. The variation in acidity values of the treated (products and controls) soils was significant (P<0.05). The lowest acidity (0.97g/L) was detected in product S treated soil while the highest acidity (1.41g/L) was found was found in soil treated with product FP followed by product FN and CNS with acidity value of 1.39 g/L each. The acidity values of untreated soil were 1.01x10⁻² g/L, while that of NPK was 0.99 x10⁻² g/L. The data indicated that there seems no significant difference among the product and control treated soil. Acidity of soil increase with addition of certain elements (Van-Breeman et al., 1983). The seemingly higher acidity values of products treated soil might be due to the sulfur, aluminum or hydrogen addition by the product in the soil or release of these metals or hydrogen ions from the soil into soluble form (Brady and Weil, 2002).
The total nitrogen content of the products and controls treated soil ranged from 2.03 x 10⁻³ to 6.58 x 10⁻³%. The least total nitrogen (2.03 x 10⁻³%) content was observed in product S treated soil, while the highest total nitrogen value (6.58x10⁻³%) was recorded in soil treated with product CFNSP followed by product FN with total nitrogen value of 6.40x10⁻³%. The difference among the total nitrogen values of the treated soils was statistically significant (P<0.05). The The data showed that higher values of nitrogen were given by the products where nitric acid was present. However, products total nitrogen values were closed to controls ones with minor elevation, which favored the products in their nitrogen provision to the soils. Nitrogen is readily available form of nitrogen and necessary for plants rapid growth (Mulvaney, 1996). Some studies also showed that acidified biochar withhold the total nitrogen from being leaching down or overhead escaping from the soil (Sarah et al., 2011), which favored the present study.
The difference in soil pH (Figure 6) was statistically significant (P<0.05) showing a trend from basic to more basic. The tendency towards basic pH favors absorption of certain elements by the plants (Yuan et al., 2011). The variation in the average values of soil pH applied with different treated wood coal and controls was also significant (P<0.05). The pH of soil treated
Table 1: Soil minerals (mg/Kg) affected treated wood coal application
| Treats | Fe | Zn | Cu | Mn | P | Na | K | Pb | Ni |
| C |
4.873j |
0.08lmnop |
0.085b |
0.59gh |
0.069ijklm |
5.3ijk |
10.60lm |
0.5ef |
0.257r |
| F |
5.242d |
0.07nopq |
0.012uv |
0.632de |
0.066lmnop |
5.8hij |
11.30jk |
0.25jkl |
0.39l |
| N |
5.041g |
0.03s |
0.032no |
0.545j |
0.059pq |
8.3d |
10.10mn |
0.14lmno |
0.537g |
| S |
5.093f |
0.08mnop |
0.014tuv |
0.409qr |
0.06opq |
4.8kl |
10.50lm |
0.71cd |
0.441j |
| P |
5.332b |
0.06qr |
0.055fgh |
0.547j |
0.089ab |
5.1jk |
14.30bcde |
0.57ef |
0.504h |
| CF |
3.456x |
0.11cde |
0.059def |
0.554ij |
0.093a |
4.3lm |
9.90mn |
0.46fgh |
0.203t |
| CN |
3.502w |
0.10ghi |
0.013tuv |
0.51lm |
0.065mnop |
4.6klm |
10.10mn |
0.12mno |
0.358m |
| CS |
4.355n |
0.09hijkl |
0.015stuv |
0.621ef |
0.071ijklm |
8.5d |
11.80j |
0.79c |
0.351m |
| CP |
3.801qr |
0.09ijklm |
0.042klm |
0.619ef |
0.085bcd |
4.kl |
11.40jk |
0.46fgh |
1.046a |
| FN |
4.946h |
0.04s |
0.023pqr |
0.654c |
0.067klmno |
4.6klm |
10.80kl |
0.05o |
0.426k |
| FS |
3.113c |
0.09ghij |
0.019qrst |
0.65cd |
0.081cdef |
4.3lm |
9.90mn |
0.36hij |
0.393l |
| FP |
5.338b |
0.15a |
0.044jkl |
0.535jk |
0.066lmnop |
4.6klm |
12.90hi |
1.54a |
0.264r |
| NS |
5.358a |
0.07nopq |
0.047ijk |
0.442op |
0.073ghijkl |
7.2ef |
12.80i |
1.02b |
0.498h |
| NP |
3.635t |
0.09hijk |
0.014tuv |
0.573hi |
0.069jklmn |
11.1b |
9.50n |
0.02o |
0.826d |
| SP |
3.528v |
0.09ijklm |
0.012uv |
0.391rst |
0.078defghi |
5.6hij |
10.30lm |
0.41ghi |
0.305p |
| CFN |
3.194b |
0.06r |
0.052ghi |
0.399rs |
0.081cdef |
9.6c |
11.20jk |
0.75c |
0.29q |
| CFS |
4.394m |
0.08mnop |
0.009v |
0.444op |
0.072hijklm |
4.3lm |
10.80kl |
0.49fg |
0.016z |
| CFP |
4.891i |
0.08jklmn |
0.014tuv |
0.371t |
0.069jklmn |
4.2lm |
10.20lm |
0.02o |
0.21st |
| FNS |
4.377m |
0.08mnop |
0.054fgh |
0.435op |
0.055q |
6.8fg |
8.60o |
0.02o |
0.585f |
| FNP |
4.609l |
0.11cde |
0.021pqrs |
0.512lm |
0.076efghij |
11.1b |
14.10def |
0.79c |
0.443j |
| FSP |
4.151o |
0.07nopq |
0.019qrst |
0.377t |
0.081cdef |
7.5ef |
13.90efg |
1b |
0.22s |
| CNS |
3.594u |
0.07opq |
0.044jkl |
0.424pq |
0.079cdefgh |
11.9a |
13.20hi |
0.22klm |
0.453j |
| CNP |
3.75s |
0.13b |
0.04lm |
0.446no |
0.065mnop |
10.9b |
13.50fgh |
0.51efg |
0.111w |
| CSP |
3.453x |
0.12cd |
0.044jkl |
0.647cd |
0.069jklmn |
8.3d |
14.70abcd |
0.12mno |
0.338n |
| FSP |
3.785r |
0.11def |
0.131a |
0.675b |
0.086abc |
7.1ef |
13.30ghi |
0.21klm |
0.091x |
| NSP |
3.814q |
0.06r |
0.037mn |
0.601fg |
0.071ijklm |
6.3gh |
14.20cde |
0.62de |
0.319o |
| CFNS |
3.062d |
0.09ijklm |
0.058defg |
0.612ef |
0.066lmnop |
5.2ijk |
14.80abc |
0.29ijk |
0.328no |
| CFNP |
3.412y |
0.12bc |
0.017rstu |
0.496m |
0.062nopq |
7.1ef |
13.90efg |
0.18klmn |
0.669e |
| CFSP |
3.848p |
0.09hijk |
0.05hij |
0.517kl |
0.081cdef |
10.1c |
14.70abcd |
0.58ef |
0.472i |
| CNSP |
5.295c |
0.13b |
0.073c |
0.465n |
0.079cdefgh |
5.2ijk |
14.50bcde |
1.05b |
0.916b |
| FNSP |
4.72k |
0.08klmnop |
0.062de |
0.324u |
0.065mnop |
5.6hij |
15.30a |
0.11mno |
0.074y |
| CFNSP |
2.853e |
0.07nopq |
0.038lmn |
0.382st |
0.076efghij |
9.9c |
14.60bcd |
0.71cd |
0.027z |
| N.P.K |
2.759f |
0.10fgh |
0.064d |
0.632de |
0.083bcde |
5.3ijk |
14.90ab |
0.13lmno |
0.843c |
| H.ACID |
3.264a |
0.10efg |
0.05hij |
0.547j |
0.08cdefg |
6.1gh |
14.30bcde |
0.06no |
0.573f |
| F.Y.M |
3.046d |
0.07pq |
0.025pq |
0.657bc |
0.074fghijk |
5.9hi |
14.50bcde |
0.44gh |
0.332n |
| W.COAL |
5.129e |
0.11de |
0.056efgh |
0.73a |
0.069jklmn |
7.8de |
14.30bcde |
0.12mno |
0.179u |
| U. SOIL |
3.333z |
0.08klmno |
0.027op |
0.311u |
0.045r |
3.9m |
14.10def |
0.21klm |
0.129v |
Treatment means in vertical columns followed by same letters were not significantly different (α=0.05). Intervals means in last row followed by same letters were not significantly different (α=0.05). Key: Hydrochloric acid (C), Sulfuric acid (F), Nitric acid (N), Sodium hydroxide (S), Potassium hydroxide (P)
with wood coal and controls ranged from 8.10 to 8.32. The lower value (8.10) of pH was recorded in soil applied with NS treated wood coal while the highest value of 8.32 was found in the soils applied with CFP and CNS treated wood coals. pH refers to hydrogen ion concentration in the soil solution. The increase in soil pH might be due to the release of some basic metals like Ca, K, C etc. (Zwieten et al., 2010)which cause elevation in soil pH. Christopher et al. (2014) also reported that biochar application, due to its high particle surface area, favors the growth of micro-flora in soil and tends to increase soil pH, EC and cations exchange capacity. These physical changes in soil, in turn increase the availability of macronutrients such as nitrogen and phosphorus.
Soil minerals were presented in Table 1. Most of the minerals in soils treated with products and controls were statistically different (P<0.05). Fe content of the treated soil ranged from 2.759 to 5.358 mg/Kg. The minimum Fe content (2.759 mg/Kg) was found in soil treated with NPK, which was used as control in this experiment, while the maximum Fe content (5.358%) was detected in soil treated with NS product which was followed by the Fe content (5.338mg/Kg) of soil applied with FP product. Zn content in the treated soil ranged from 0.03 to 0.15 mg/Kg. The least amount of Zn i.e. 0.03mg/Kg was perceived in soil applied with N product, while the highest content (0.15 mg/Kg) of Zn was identified in soil treated with FP product.
Copper ranged from 0.012 to 0.131 mg/Kg in treated soil. The minimum content that is 0.012mg/Kg was found in the soil applied with N and SP products respectively, while the highest content (0.131mg/Kg) was observed in FSP product treated soil. Mn was also present in the treated soil in detectable amount that ranged from 0.324 to 0.73 mg/Kg. The minimum amount (0.324 mg/Kg) was found in soil treated with FNSP product; while the maximum amount (0.73 mg/Kg) was perceived in wood coal treated soil that was used as control in the study.
Phosphorus amount in the treated soil was very less that ranged from 0.045 to 0.093 mg/Kg. The lowest amount (0.045 mg/Kg) was found in U. Soil which was used as control in the study, while the highest amount (0.093 mg/Kg) was observed in the soil applied with CF product. Na in the treated soil ranged from 3.9 to 11.9 mg/Kg. The least Na (3.9 mg/Kg) was detected in U. Soil just like Phosphorus, The U. soil (Untreated soil) was used as control during the study, however, the maximum amount (11.9 mg/Kg) was detected in soil treated with CNS product, that was followed by the amount of Na (11.1%) in soil treated with FNP product.
The amount of potassium in the treated soil ranged from 8.60 to 15.30 mg/Kg. The least amount of K i.e. 8.60 mg/Kg was identified in soil treated with FNS product, while the highest amount (15.30mg/Kg) of K was determined in soil applied with FNSP product, where Cu was minimum. Pb and Ni content was also determined that were considered as toxic in high amount. A detectable amount of both metals was was present in the soil, which shows presence of these metals in soil and also in coal products. Pb ranged from 0.02 mg/Kg in soils applied with NP, CFP and FNS products, while the highest amount 1.54 mg/Kg as detected in soil applied with FP product. Ni in the treated soil ranged from 0.027 to 1.046 mg/Kg. The lowest amount (0.027mg/Kg) of Ni was detected in CFNSP product applied soil while the highest amount (1.046 mg/Kg) was present in the soil treated with CP product. Soil minerals variation might be due the minerals present in the products (Tranaviciene et al., 2008). That could also be explained by the leaching effect of acid and bases of minerals from solid materials like soil itself and also that of coal content of the products (Ishaq et al., 2002). The humic content might be another reason of for soil mineral variation during experiments (Sadia and Nikos, 2009), because larger amount of humic acid withhold larger amount minerals along the soil particles (Rajpar et al., 2011; Verlinden et al., 2009; Sara et al., 2010).
Authors’ Contribution
All authors contributed equally.
References
AOAC (Association of official Analytical Chemistry). 2000. Official Methods of Analysis (Ed. Helrich, K.) 15th ed. Arlington, Virginia. USA.
Adviento-Borbe, M.A., J.W. Doran, R.A. Drijber and Doberman. 2006. A. Soil electrical conductivity and water content affect nitrous oxide and carbon dioxide emissions in intensively managed soils. J. Environ. Qual. 35. https://doi.org/10.2134/jeq2006.0109
Akinci, S., T. Buyukkeskin, A. Eroglu and B.E. Erdogan. 2009. The effect of Humic Acid on Nutrient Composition in Broad Bean (Viciafaba L.) Roots J. Nut. Biol. Sci. 1: 81-87.
Anderson-Cook, C.M., M.M. Alley, J.K. Roygard, R. Khosla, R.B. Noble, and J.A. Doolittle. 2002. Differentiating soil types using electromagnetic conductivity and crop yield maps. Soil Sci. Soc. Am. J. 66:1562-1570. https://doi.org/10.2136/sssaj2002.1562
Bohra developers. 2015. www.gsp.gov.pk. All rights Reserved.
Brady, N.C. and R.R. Weil. 2002. Elements of the Nature and Properties of Soils. Prentice Hall, New Jersey.
Bremner, J. M. and C.S. Mulvaney. 1982. Nitrogen total. Pp.395-622. In: A.L. Page, Miller and D.R. Keeney, (eds). Method of soil analysis, Part-II.2nd edition. Am. Soc. Agron. Madison. WI.
Chen, Y.C.Y.W., X. Tang, S.M. Yang and J.Y. Wang. 2010. Fate of Nitrogen from organic and Inorganic sources in Rice-Wheat Rotation Cropping System. Agri. Sci. China. 9: 1017-1025. https://doi.org/10.1016/S1671-2927(09)60185-1
Christopher, R.S., 2014. The productive reuse of coal, biomass and co-fired fly ash. Vitruvius, De architectura, “Pozzolana,” Book II, Chapter VI, 1st century B.C
Davidsson, K.H.O., J.G. Korsgren, J.B.C. Pettersson and U. Jäglid. 2002. The effects of fuel washing techniques on alkali release from biomass, Fuel 81: 137-142. https://doi.org/10.1016/S0016-2361(01)00132-6
Eyheraguibel, B., J. Silvestre and P. Morard. 2008. Effects of Humic substances derived from organic waste enhancement on the growth and mineral nutrition of maize. J. Biores. Tech. 99: 4206-4212. https://doi.org/10.1016/j.biortech.2007.08.082
Glaser, B., J. Lehmann and W. Zech. 2002. Ameliorating physical and chemical properties of highly weathered soils in the tropics with charcoal. A Review. J. Biol. Ferti. Soils. 35: 219-230. https://doi.org/10.1007/s00374-002-0466-4
Hamalainen, J.P and M.J. Aho. 1995. Effect of fuel composition on the conversion of volatile solid furel-N to N20 and NO Fuel. J. Environ. Mgt. 74:1922-1924.
Ishaq, M., I. Ahmad, M.S. Ullah, A. Bahader and N. Taj. 2002. Characterization of khushab coal (Punjab Pakistan). J. chem. soc. pak. 24: 240-245.
Ishaq, M., I. Ahmad, M.S. Ullah, A. Bahader and N. Taj. 2002. Characterization of khushab coal (Punjab Pakistan). J. chem. soc. pak. 24: 240-245
Mc-Clean, E.O. 1984. Soil pH and lime requirement. Methods of soil analysis part-ll, 2nd ed. Agron. 9: 199-203.
Mulvaney, R.L. 1996. Nitrogen-Inorganic Forms. Soil Science Society of America and American Society of Agronomy, 677 S. Segoe Rd., Madison, WI 53711, USA. Methods of Soil Analysis Part 3.Chemical Methods-SSSA Book Series no. 5.
Nelson, D.W. and L.E. Sommer. 1982. Total carbon, organic C and organic matter. pp. 539-577. In: A.L. Page, Miller and D.R. Keeney, (eds). Method of soil analysis, Part-II.2nd edition. Am. Soc. Agron. Madison. WI.
Oh, S.J., T.Y. Ko, S.C. Kim, S. Oh, S.W. Lee, Y.S. Ok and J.E. Yang. 2014. Evaluation of Fly Ash Fertilizer for Tomato (Lycopersiconesculentum) Growth in Agricultural Field. ASA, CSSA, and SSSA Int. Ann. Meeting Nov. 2-5/ Long beach, CA.
Patriquin, D.E., H. Blaikie, M.J. Patriquin and C. Yang. 1993. On-farm measurements of pH, electrical conductivity, and nitrate in soil extracts for monitoring coupling and decoupling of nutrient cycles. Biol. Agric. Hort. 9: 231-272. https://doi.org/10.1080/01448765.1993.9754638
Piccolo, A., G. Celano and G. Pietramellara. 1993. Effects of fractions of coal-derived humic substances on seed germination and growth of seedlings (Lactuga sativa and Lycopersicumesculentum). Biol. Fertil. Soils. 16:11-15. https://doi.org/10.1007/BF00336508
Rajpar, M.B.B., Z.U. Hassan, A.N. Shah and S.D. Tunio. 2011. Humic acid improves growth, yield and oil content of brassica compestrisl. Pak. J. Agric. Agril. Engg. Vet. Sci. 27:125-133.
Robert, B.G., M. Alley, W.G.T. Virginia, D. Holshouser and W. Thomason. 2009. Precision Farming Tools: Soil Electrical Conductivity. Produced by Communications and Marketing, College of Agriculture and Life Sciences, Virginia Polytechnic Institute and State University.
Sadia, I. and M. Nikos. 2009. Effect of Humic Acid and Calcium Carbide on Growth and Yield of Tomato ISBN: 978-960-474-404-6 Recent Advances in Urban Planning, Sustainable Development and Green Energy.
Sara, T., O. Francioso, S. Quaggiotti, and S. Nardi. 2010. Humic substances biological activity at the plant-soil interface. Plt. Signal Behav. 5: 635-643. https://doi.org/10.4161/psb.5.6.11211
Sarah, A.D., L.C. Miguel, C.D. Keshav, W.G. Julia, S.S. Leticia and P.M. William. 2011. Release of Nitrogen and Phosphorus from Poultry Litter Amended with Acidified Biochar. Int. J. Environ. Res. Public Health. 8: 1491-1502. https://doi.org/10.3390/ijerph8051491
Sarah, A.D., L.C. Miguel, C.D. Keshav, W.G. Julia, S.S. Leticia and P.M. William. 2011. Release of Nitrogen and Phosphorus from Poultry Litter Amended with Acidified Biochar. Int. J. Environ. Res. Public Health. 8: 1491-1502. https://doi.org/10.3390/ijerph8051491
Seshadri, B., N.S. Bolan, R. Naidu and K. Brodie. 2010. The role of coal combustion products in managing the bioavailability of nutrients and heavy metals in soils. J. Soil Sci. Plt. Nut. 10:378 – 398. https://doi.org/10.4067/s0718-95162010000100011
Singh, A., R.K. Sharma and S.B. Agrawal. 2008. Effects of fly ash incorporation on heavy metal accumulation, growth and yield responses of Beta vulgaris plants. J. Biores. Tech. 99:7200-07. https://doi.org/10.1016/j.biortech.2007.12.064
Smith, J.L. and J.W. Doran. 1996. Measurement and use of pH and electrical conductivity for soil quality analysis. P. 169-185 In J.W. Doran and A.J. Jones (ed.) Methods for assessing soil quality. Soil Sci. Soc. Am. Spec. Publ. 49.SSSA, Madison, WI.
Stephen, W.K. 1994. Proposal for experimentation with Arkansas lignite to identify organic soil supplements suitable to regional agricultural needs. 501: 968-0202.
Tranavičienė, T., A. Urbonavičiūtė, G. Samuolienė, P. Duchovskis, I. Vagusevičienė and A. Sliesaravičius. 2008. The effect of differential nitrogen fertilization on photosynthetic pigment and carbohydrate contents in the two winter wheat varieties. Agro. Res. 6: 555-561.
Vaccaro, S. 2010. Demineralization and desulfurization process to generate clean coal. Chem. Eng. Transactions. 21: 1489-1494.
Van-Breemen, N., J. Mulder and C.T. Driscoll. 1983. Acidification and alkalinization of soils. Plt. Soil. 75: 283-308. https://doi.org/10.1007/BF02369968
Verlinden, G., B.Pycke, J. Mertens, F. Debersaques, K. Verheyen, G.Baert, J. Bries, and G. Haesaert. 2009. Application of humic substances results in consistent increases in crop yield and nutrient uptake. J. Plt. Nut. 32:1407- 1426. https://doi.org/10.1080/01904160903092630
Yuan, J.H., X. Ren-Kou, N. Wang and J. Li. 2011. Amendment of acid soils with crop residues and biochars. Pedosphere. 21: 302-308. https://doi.org/10.1016/S1002-0160(11)60130-6
Zwieten, L.V., S. Kimber, S. Morris, K.Y. Chan, A. Downie, J. Rust, S. Joseph, S. Cowie. 2010. Effects of biochar from slow pyrolysis of papermill waste on agronomic performance and soil fertility. Plt. Soil. 327:235-246. https://doi.org/10.1007/s11104-009-0050-x
To share on other social networks, click on any share button. What are these?