
Reaction and Diversity Analysis to Identify Novel Genetic Resources for Exserohilum turcicum Resistance in Maize


Reaction and Diversity Analysis to Identify Novel Genetic Resources for Exserohilum turcicum Resistance in Maize
Shishir Sharma1*, Suk Bahadur Gurung2, Ritesh Kumar Yadav1, Bibek Phulara1 and Laxmi Prasad Joshi1
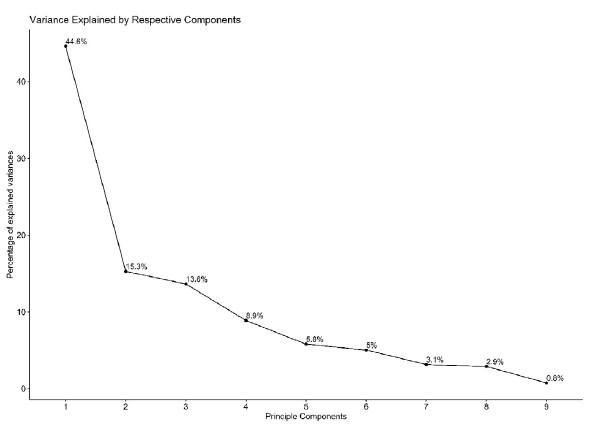
Each principal component contributes to the total explained variance in the diversity of maize inbred lines based on various disease parameters and grain yield.
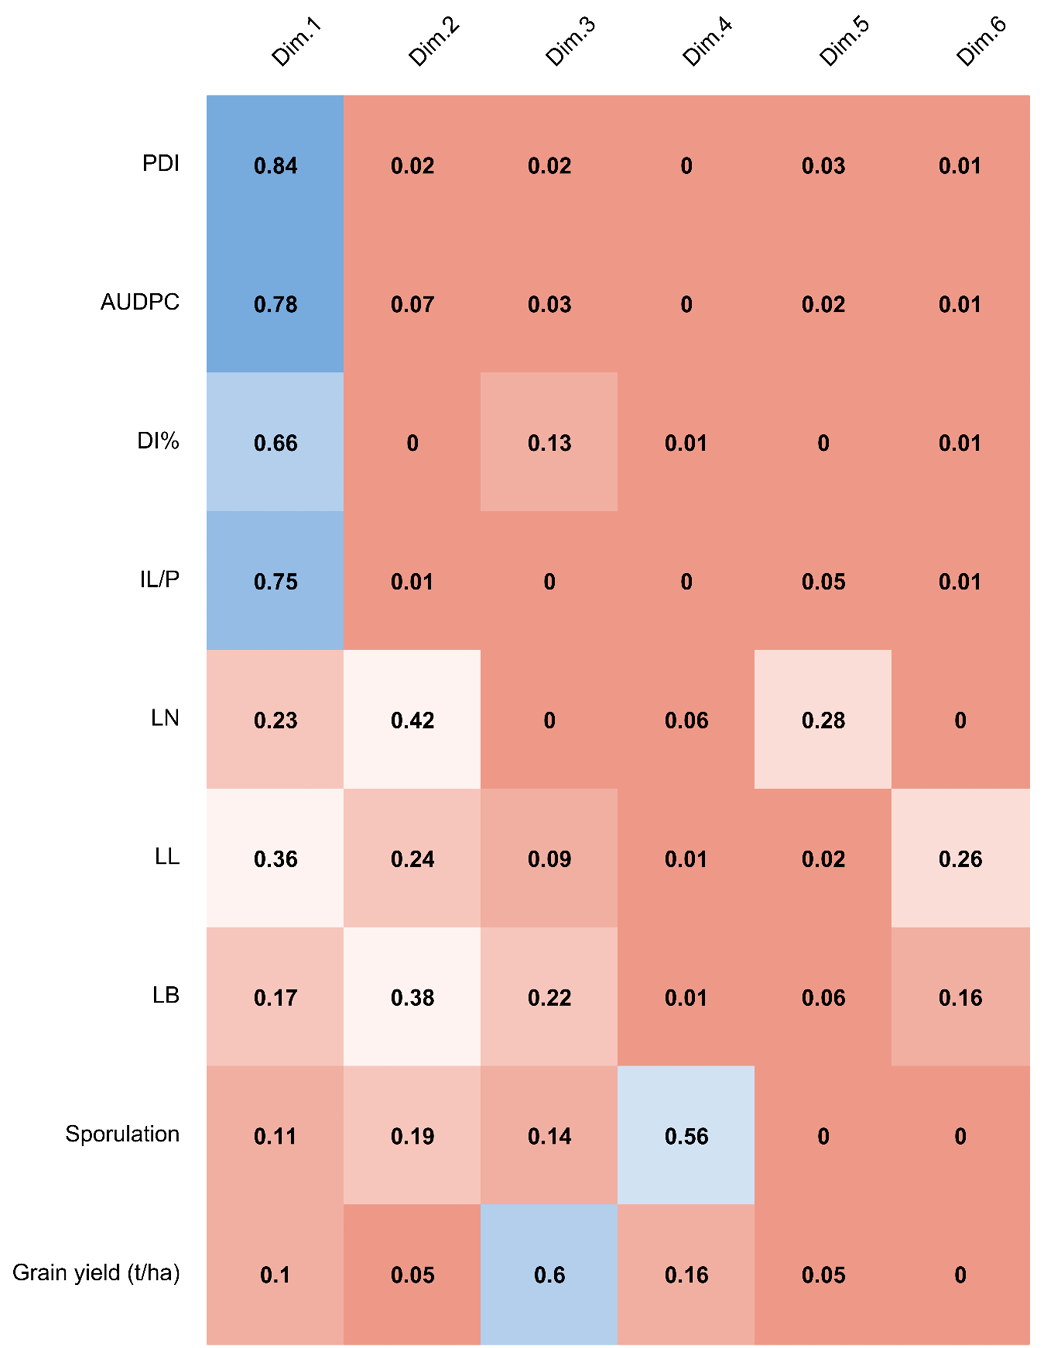
The principal component analysis and component value for 8 different disease parameters and grain yield of 101 maize inbred lines. The blue hue represents the maximum positive impact, while the red color represents the lowest positive or no contribution (PDI: Percent disease index, AUDPC: Area under the disease progress curve, DI %: Disease incidence %, IL/P: Infected leaves per plant, LN: Lesion number per leaf, LL: Lesion length in mm, LB: Lesion breadth in mm).

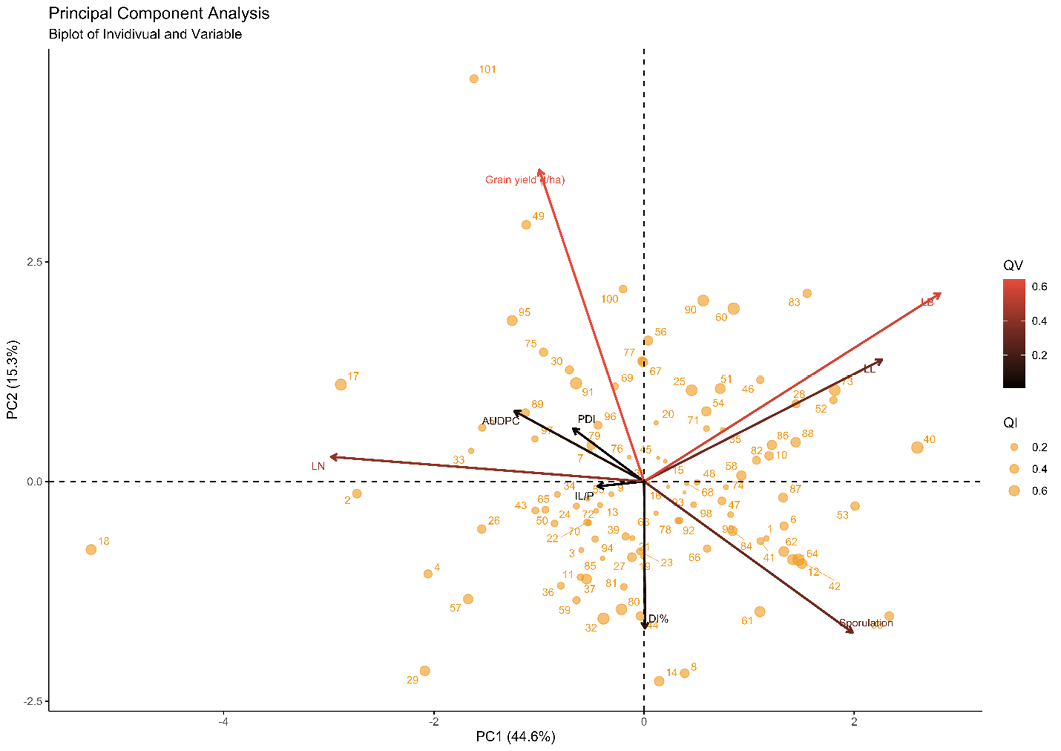
The biplot of 101 maize inbred lines for PC1 and PC2. The arrows depict the size and direction of the trait’s impact in PC1 and PC2. Individual quality of representation (QI) and variable quality of representation (QV) are two different concepts.

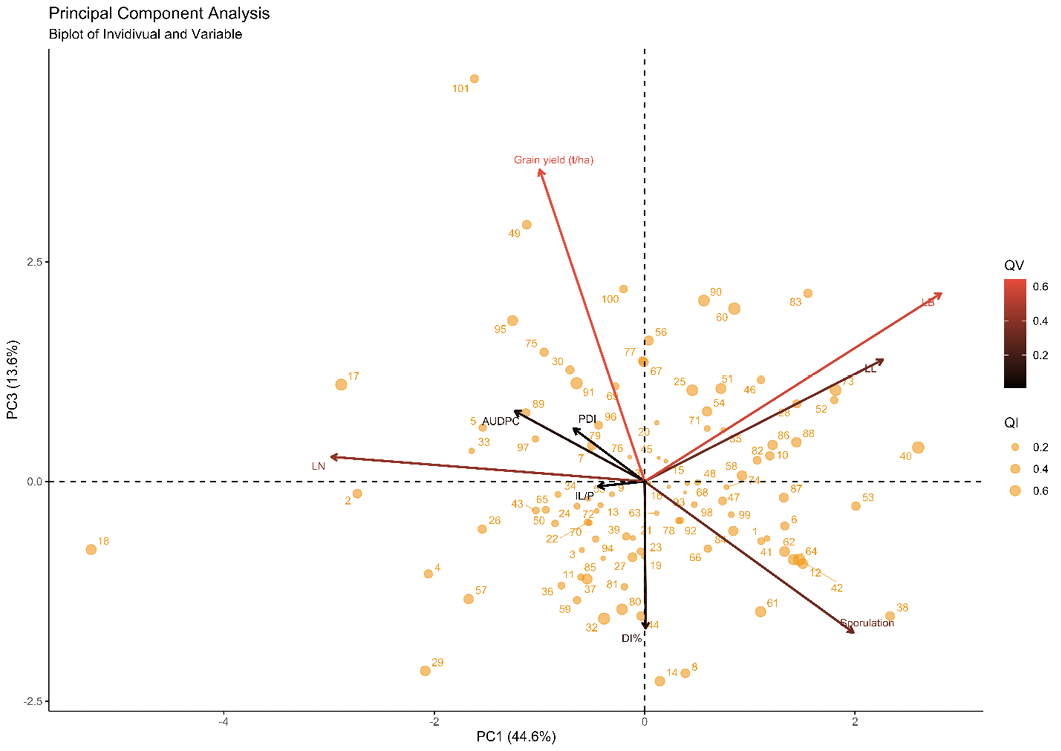
The biplot of 101 maize inbred lines for PC1 and PC3. The arrows depict the size and direction of the trait’s impact in PC1 and PC3. Individual quality of representation (QI) and variable quality of representation (QV) are two different concepts.

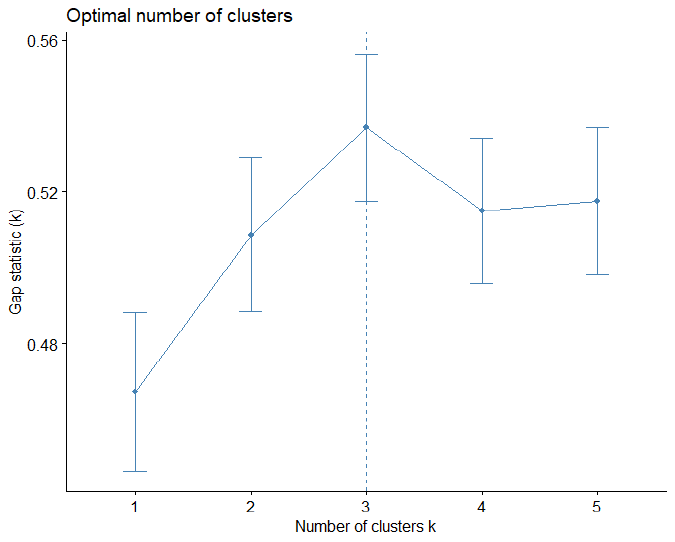
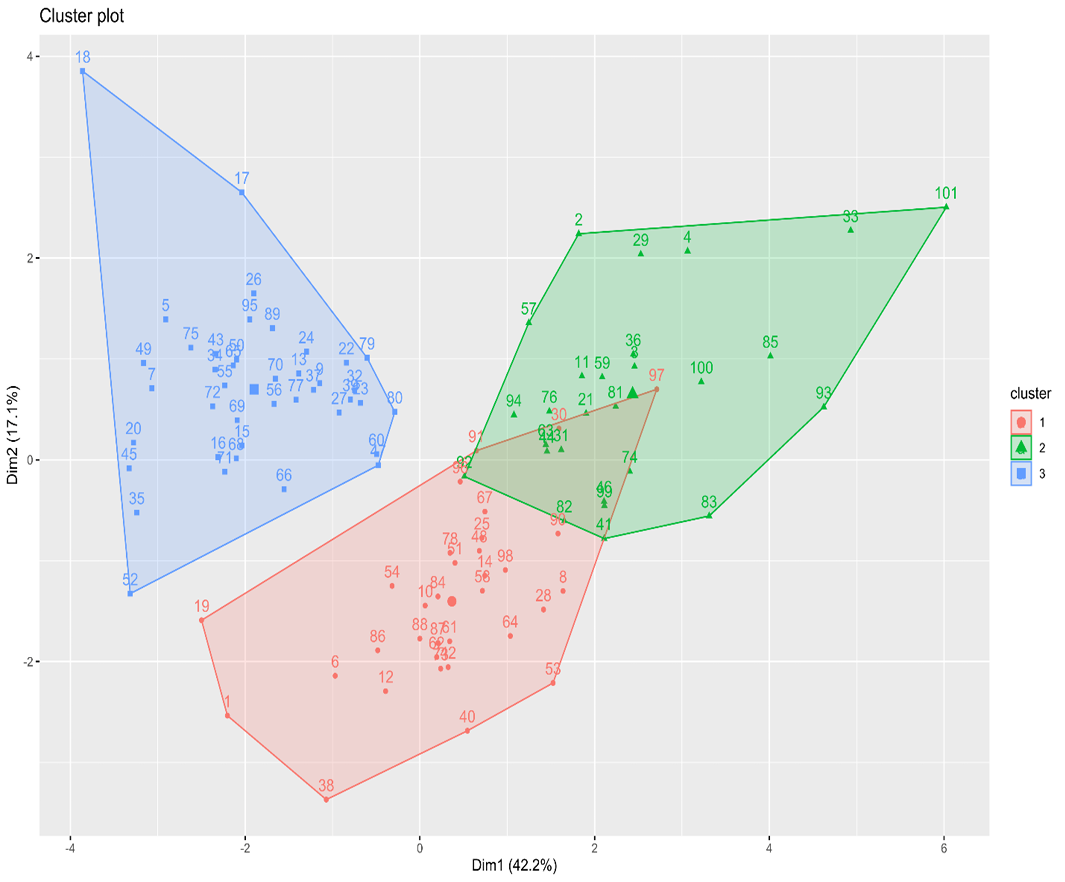
Hierarchical clustering of 101 genotypes using Ward’s method for identification of resistant sources against NLB of maize under field conditions at Rampur, Chitwan during 2020/21.

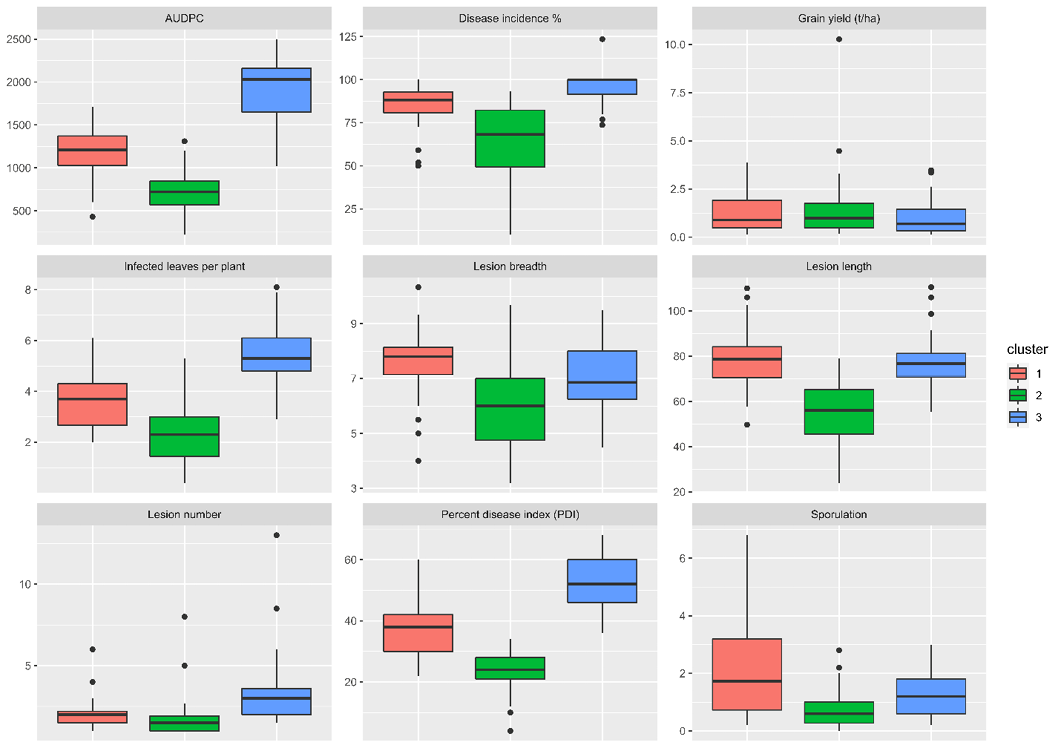
Box plot of each cluster for various disease parameters and grain yield: mean with standard error value of 101 maize inbred lines.


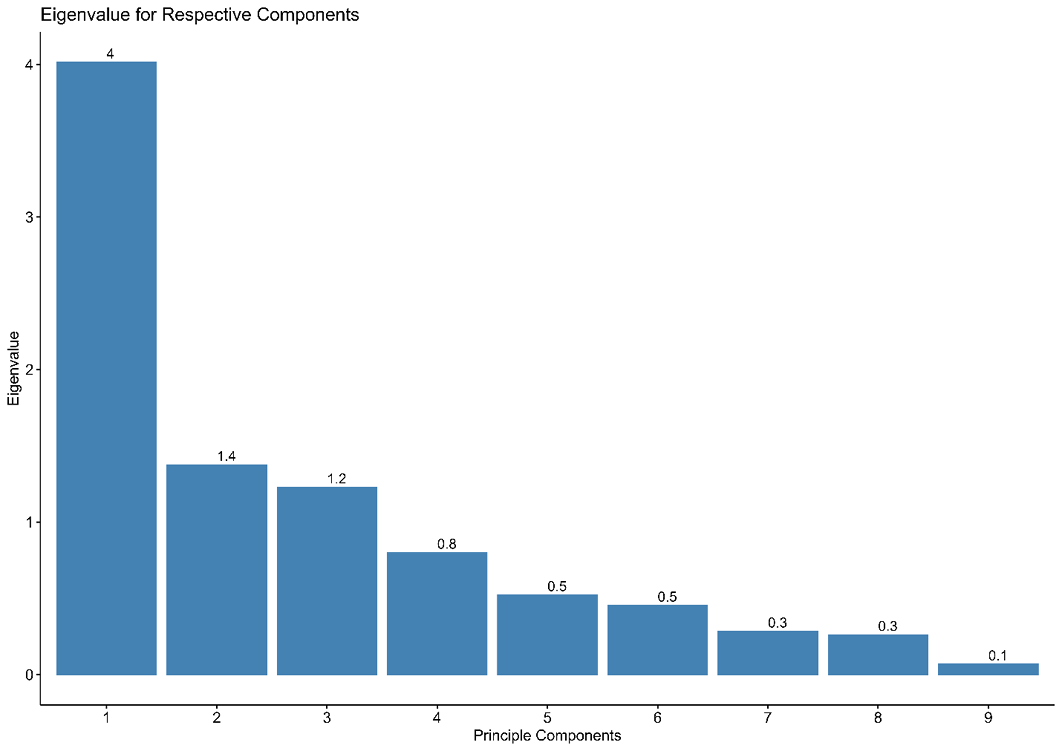
Eigenvalues of different principal components as shown by principal component analysis of maize inbred lines.

