


Serological Evidence of Bluetongue in Iran: A Meta-Analysis Study
Masoud Hassani1* and Omid Madadgar2,3
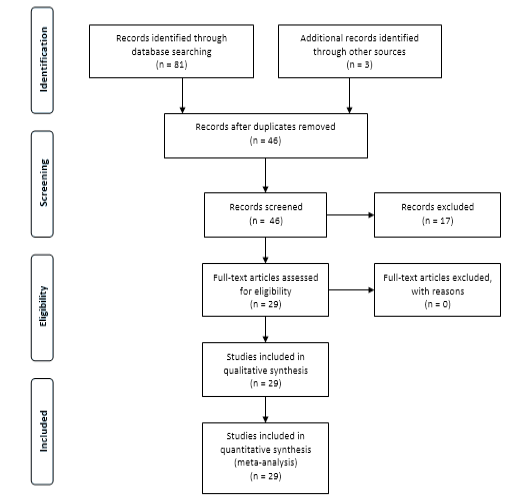
PRISMA flow diagram (included and excluded records).
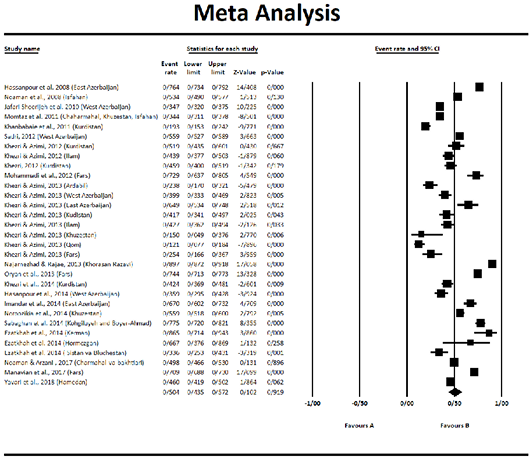
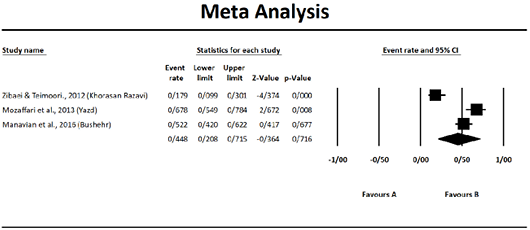
Forest plot for the seroprevalence of bluetongue in sheep population at animal level in Iran.
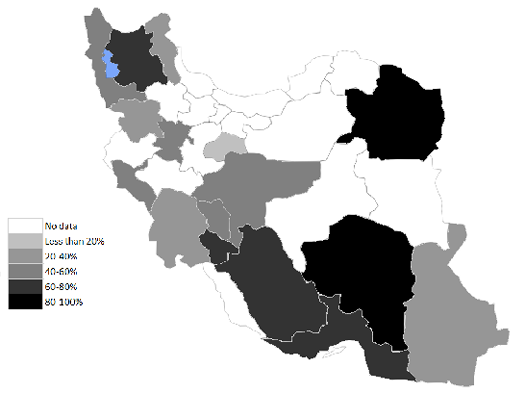
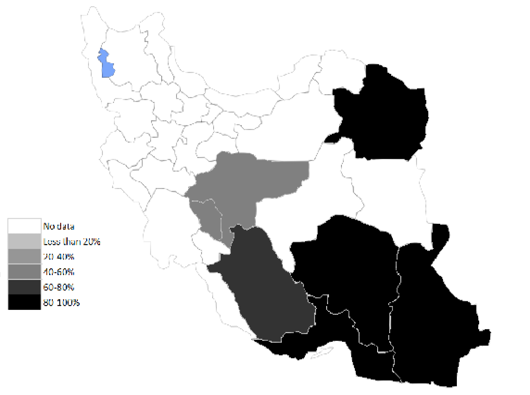
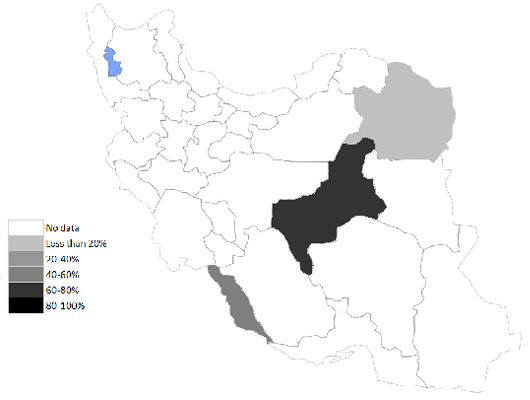
Spatial distribution of bluetongue seroprevalence in sheep population at animal level in Iran.
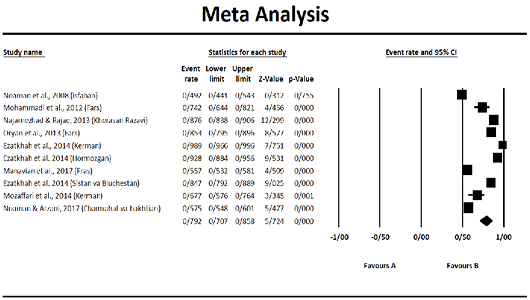
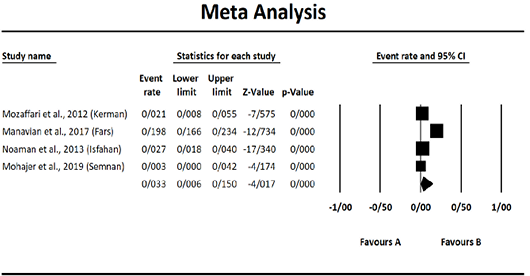
Forest plot for the seroprevalence of bluetongue in goat population at animal level in Iran.
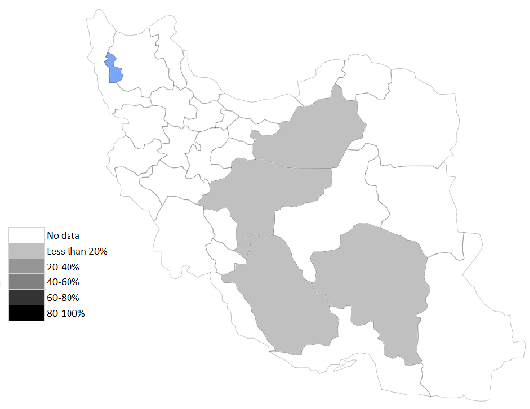
Spatial distribution of bluetongue seroprevalence in goat population at animal level in Iran.

Forest plot for the seroprevalence of bluetongue in cattle population at animal level in Iran.

Spatial distribution of bluetongue seroprevalence in cattle population at animal level in Iran.
Forest plot for the seroprevalence of bluetongue in camel population at animal level in Iran.

Spatial distribution of bluetongue seroprevalence in camel population at animal level in Iran.

