

Immunosuppressive, Anti-Inflammatory, and Antioxidant Effects of Simvastatin on Pristane Induced Arthritis


Immunosuppressive, Anti-Inflammatory, and Antioxidant Effects of Simvastatin on Pristane Induced Arthritis
Azza M. El-Kattawy1, Tarek Abou Zed1, Randa Megahed1 and Mohammed El-Magd2*

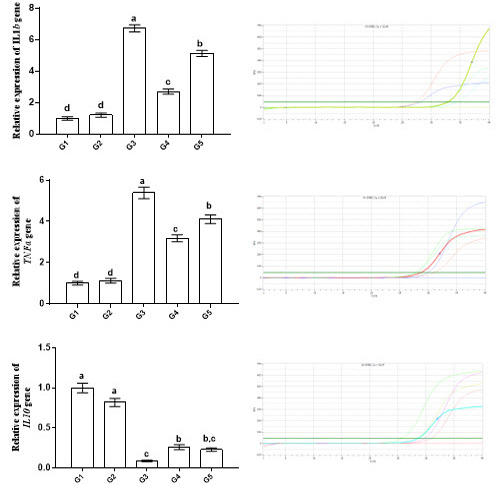
Effect of Sim on the expression of inflammation-related genes (IL1β, TNFα, IL10) in the synovium of pristane-induced arthritic mice as detected by qPCR. Data were expressed as mean fold change ± SEM (n = 5) from the Cnt group (G1). Amplification curves showing the cycle threshold (Ct) values were displayed next to each gene. Columns with different letters (a-d) are significantly different at P<0.05. G1, Cnt; G2, Sim; G3, RA; G4, RA+Sim-co; G5, RA+Sim-post group.

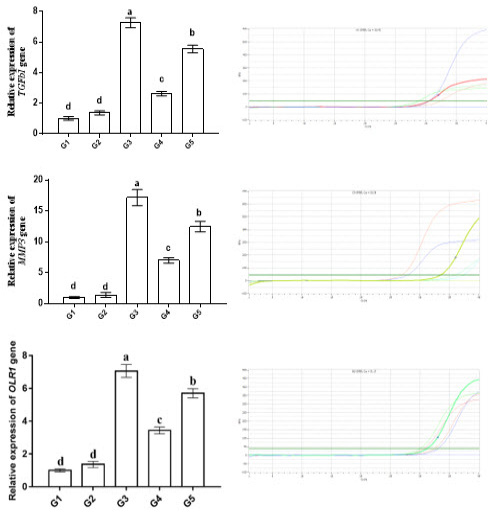
Effect of Sim on the expression of TGFβ, MMP3, and OLR1 genes in the synovium of pristane-induced arthritic mice as detected by qPCR. Data were expressed as mean fold change ± SEM (n = 5) from the Cnt group (G1). Amplification curves showing the cycle threshold (Ct) values were displayed next to each gene. Columns with different letters (a-d) are significantly different at P<0.05. G1, Cnt; G2, Sim; G3, RA; G4, RA+Sim-co; G5, RA+Sim-post group.

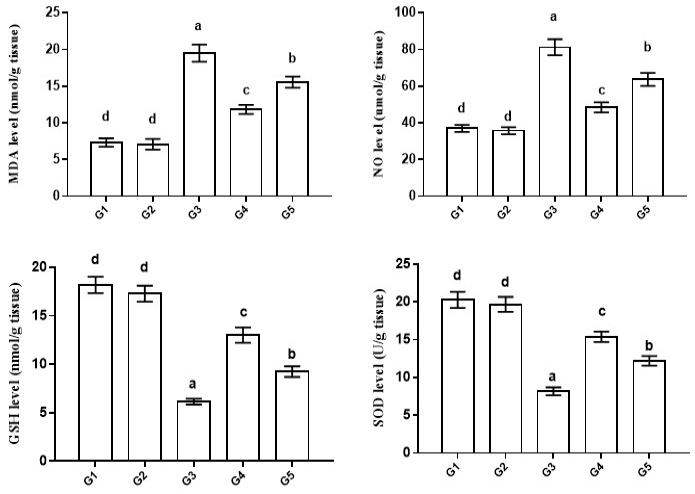
Effect of Sim on oxidative stress (MDA and NO) and antioxidant (GSH, and SOD) markers in the synovium of pristane-induced arthritic mice. Data were expressed as mean ± SEM (n = 5) from the Cnt group (G1). Columns with different letters (a-d) are significantly different at P<0.05. G1, Cnt; G2, Sim; G3, RA; G4, RA+Sim-co; G5, RA+Sim-post group.

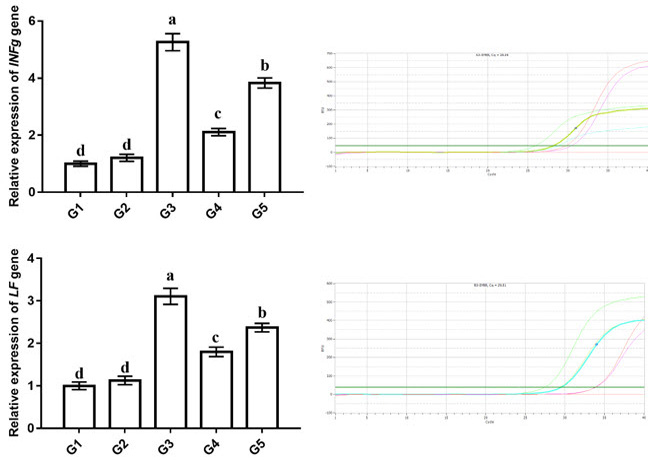
Effect of Sim on the expression of immunomodulatory INFγ and LF genes in the synovium of pristane-induced arthritic mice as detected by qPCR. Data were expressed as mean fold change ± SEM (n = 5) from the Cnt group (G1). Amplification curves showing the cycle threshold (Ct) values were displayed next to each gene. Columns with different letters (a-d) are significantly different at P<0.05. G1, Cnt; G2, Sim; G3, RA; G4, RA+Sim-co; G5, RA+Sim-post group.


