
Isolation, Identification, and Screening of Keratinase Producing Bacteria from Soil and Production Optimization Using Feather Waste as Substrate


Isolation, Identification, and Screening of Keratinase Producing Bacteria from Soil and Production Optimization Using Feather Waste as Substrate
Farha Deba1, Rubina Nelofer2 and Muhammad Irfan1*

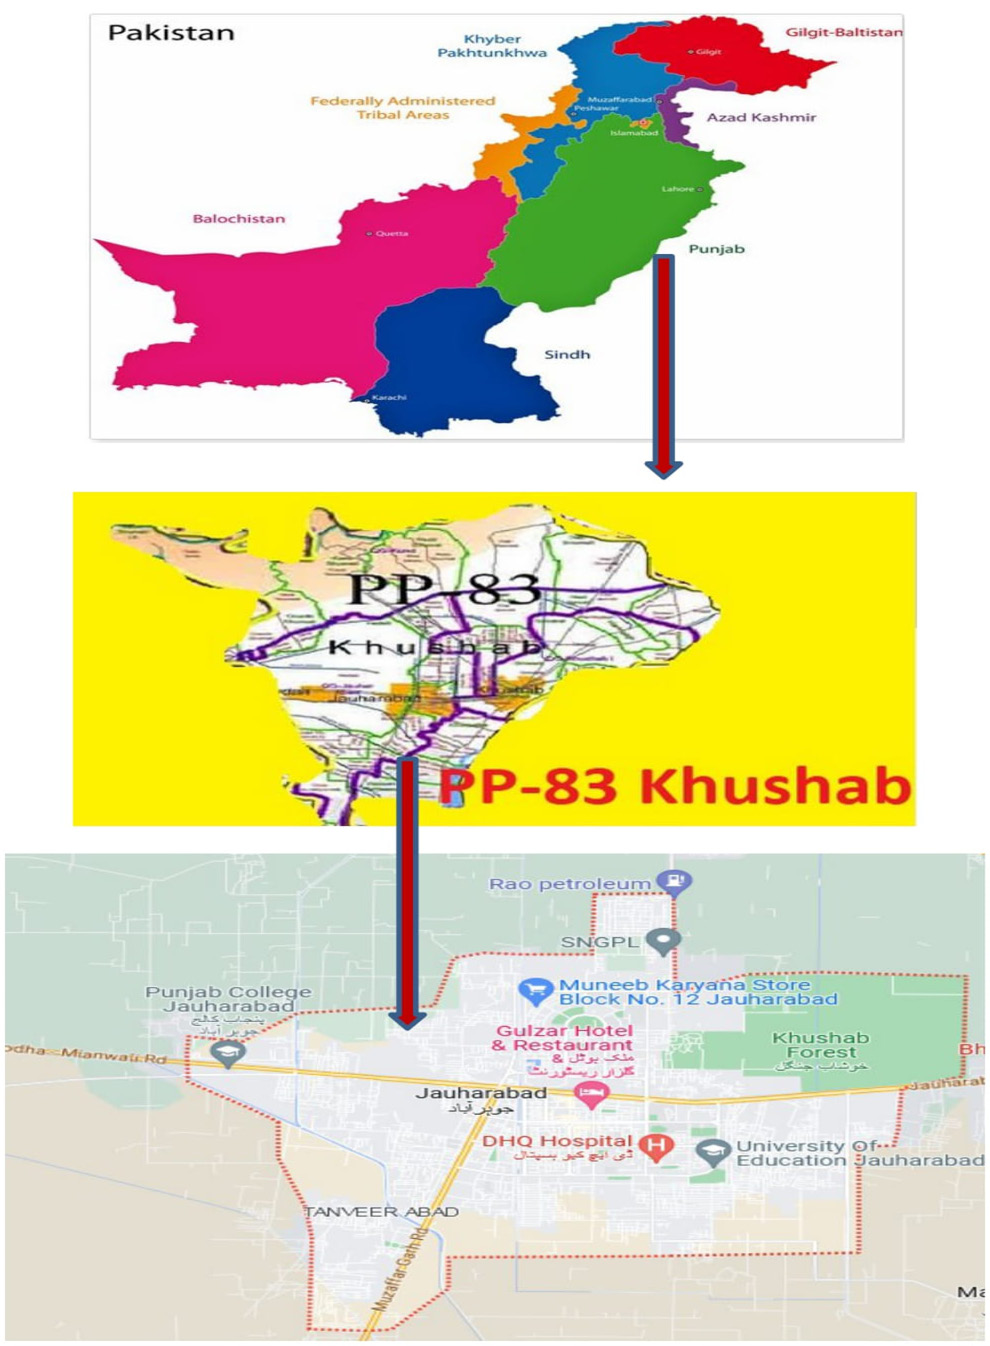
Map of District Khushab Jauharabad, Pakistan sampling sites.
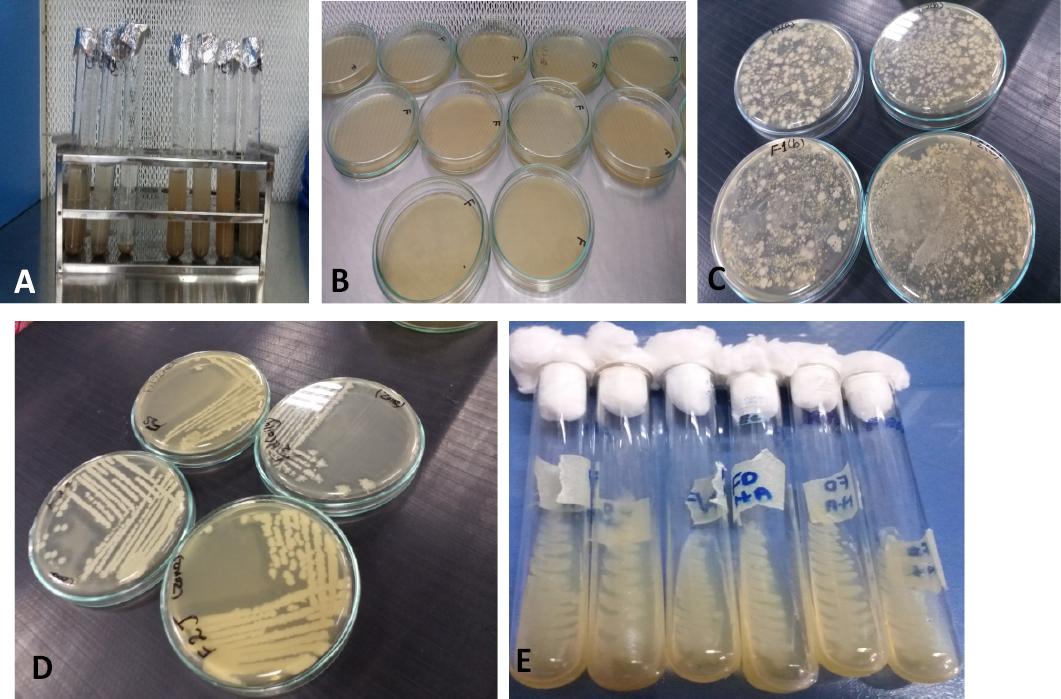
Different isolation phases of keratinase-producing bacterial strains isolated from feather composted sites and soil samples (A) Serial dilution method; (B) Pouring method; (C) After spreading method, bacterial colonies are obtained on nutrient agar plates; (D) Streaking method; (E) Slants of pure culture are saved.

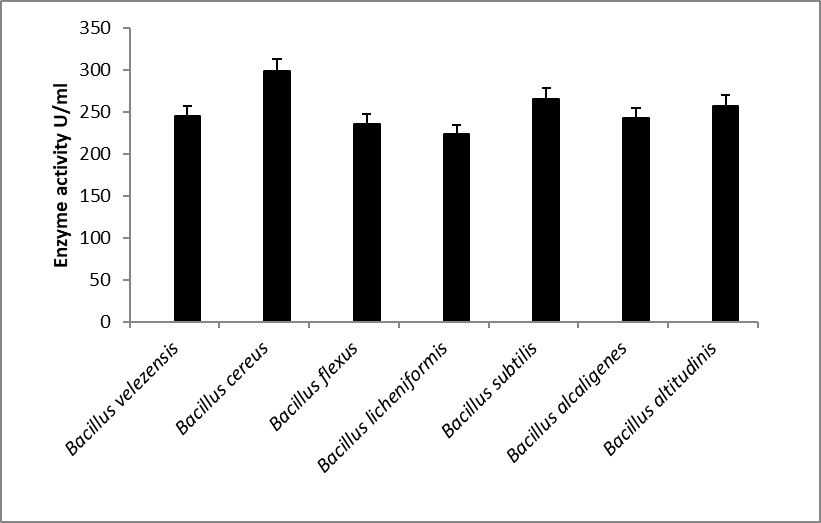
Screening of seven bacterial isolates for keratinase production under submerged fermentation (SMF) method.

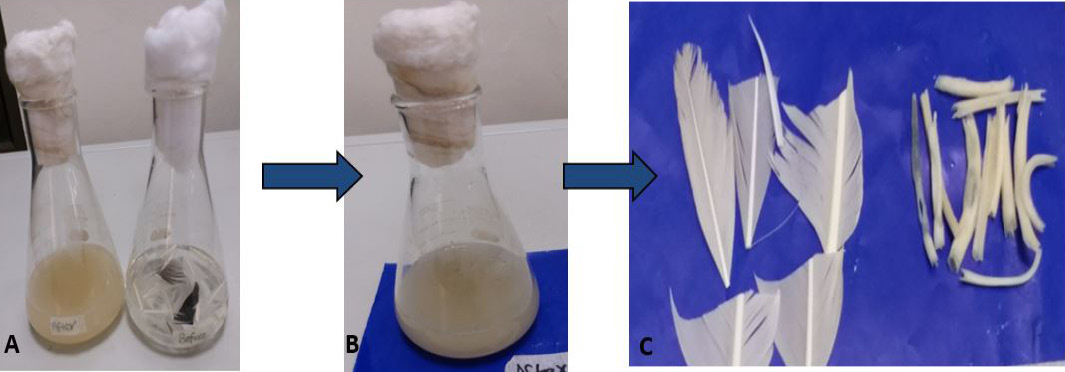
Secondary screening and successive feather degradation s of Bacillus cereus FD2 for keratinase production under submerged fermentation (SMF) method.

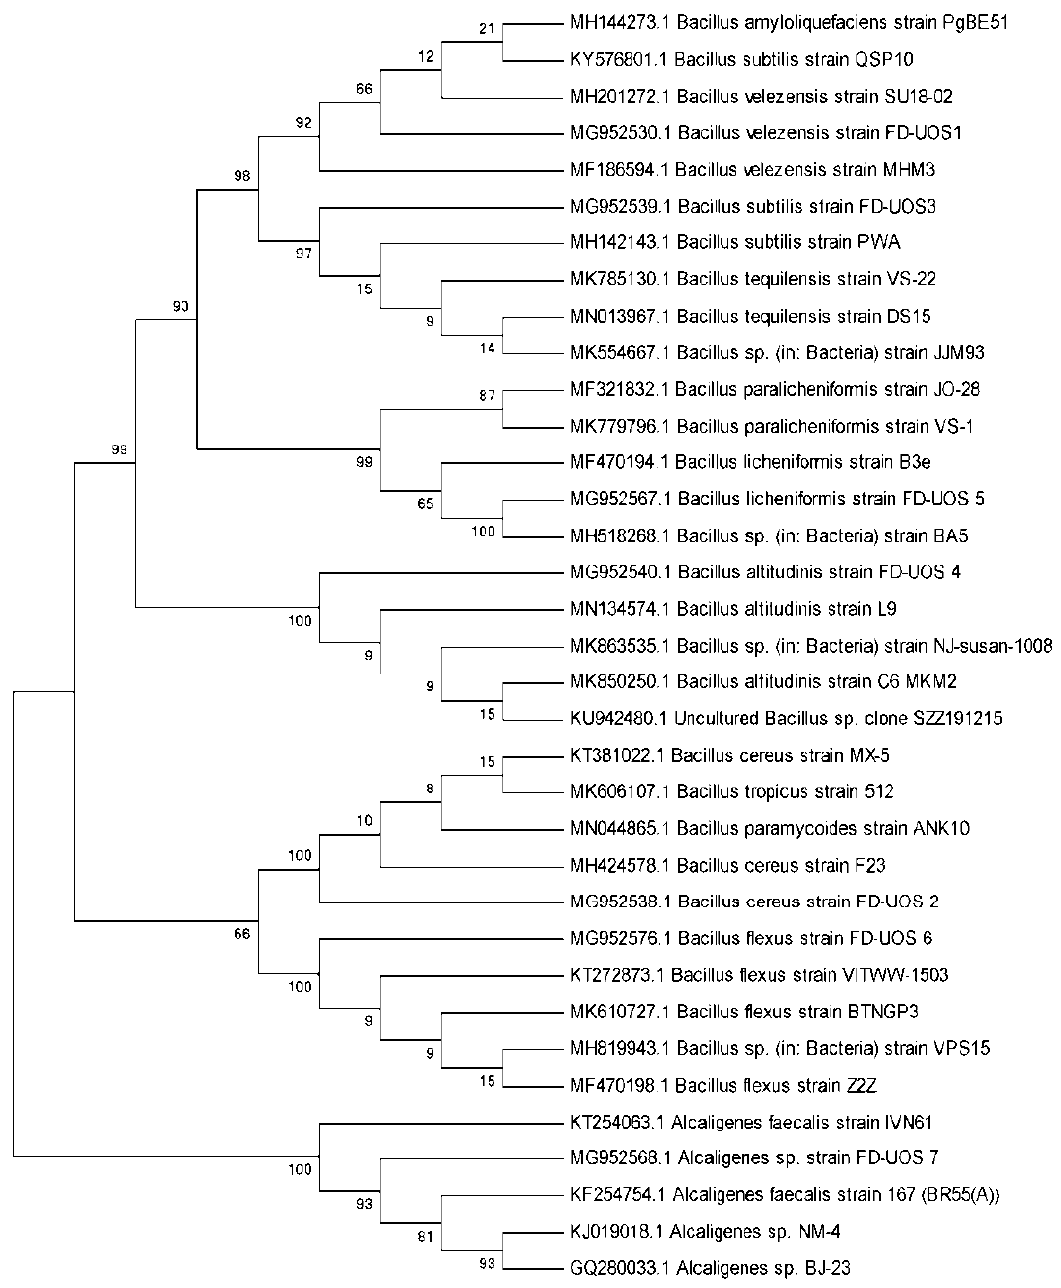
Phylogenetic analysis of identified strains isolated from feather-compost soil samples.
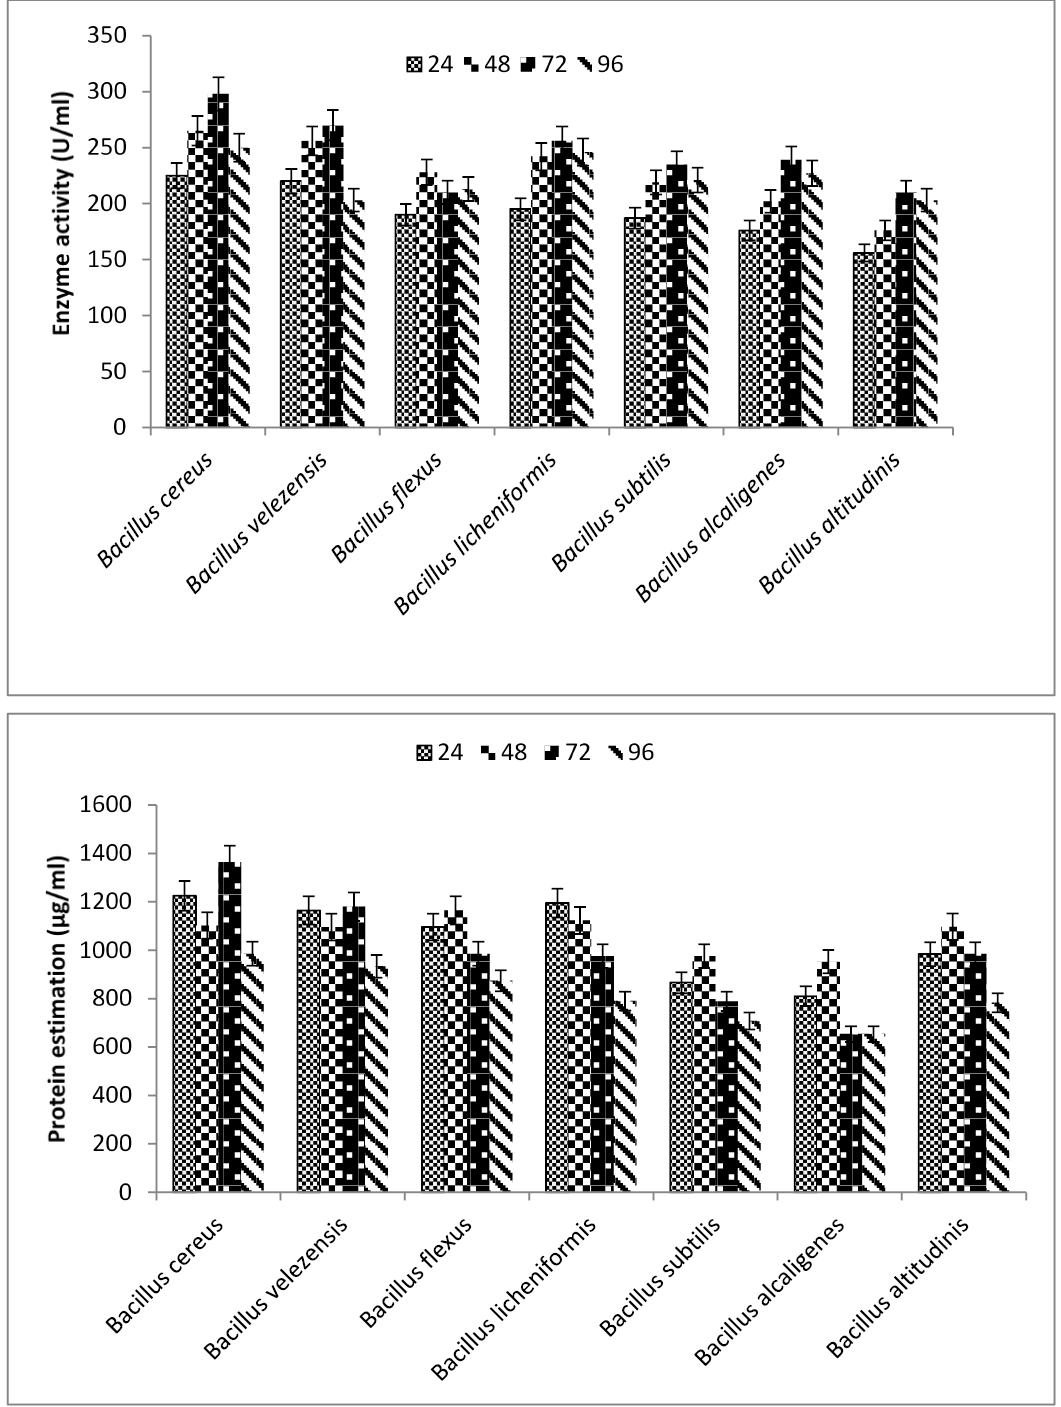
Effect of incubation time on keratinase production and protein estimation by different bacterial strains.
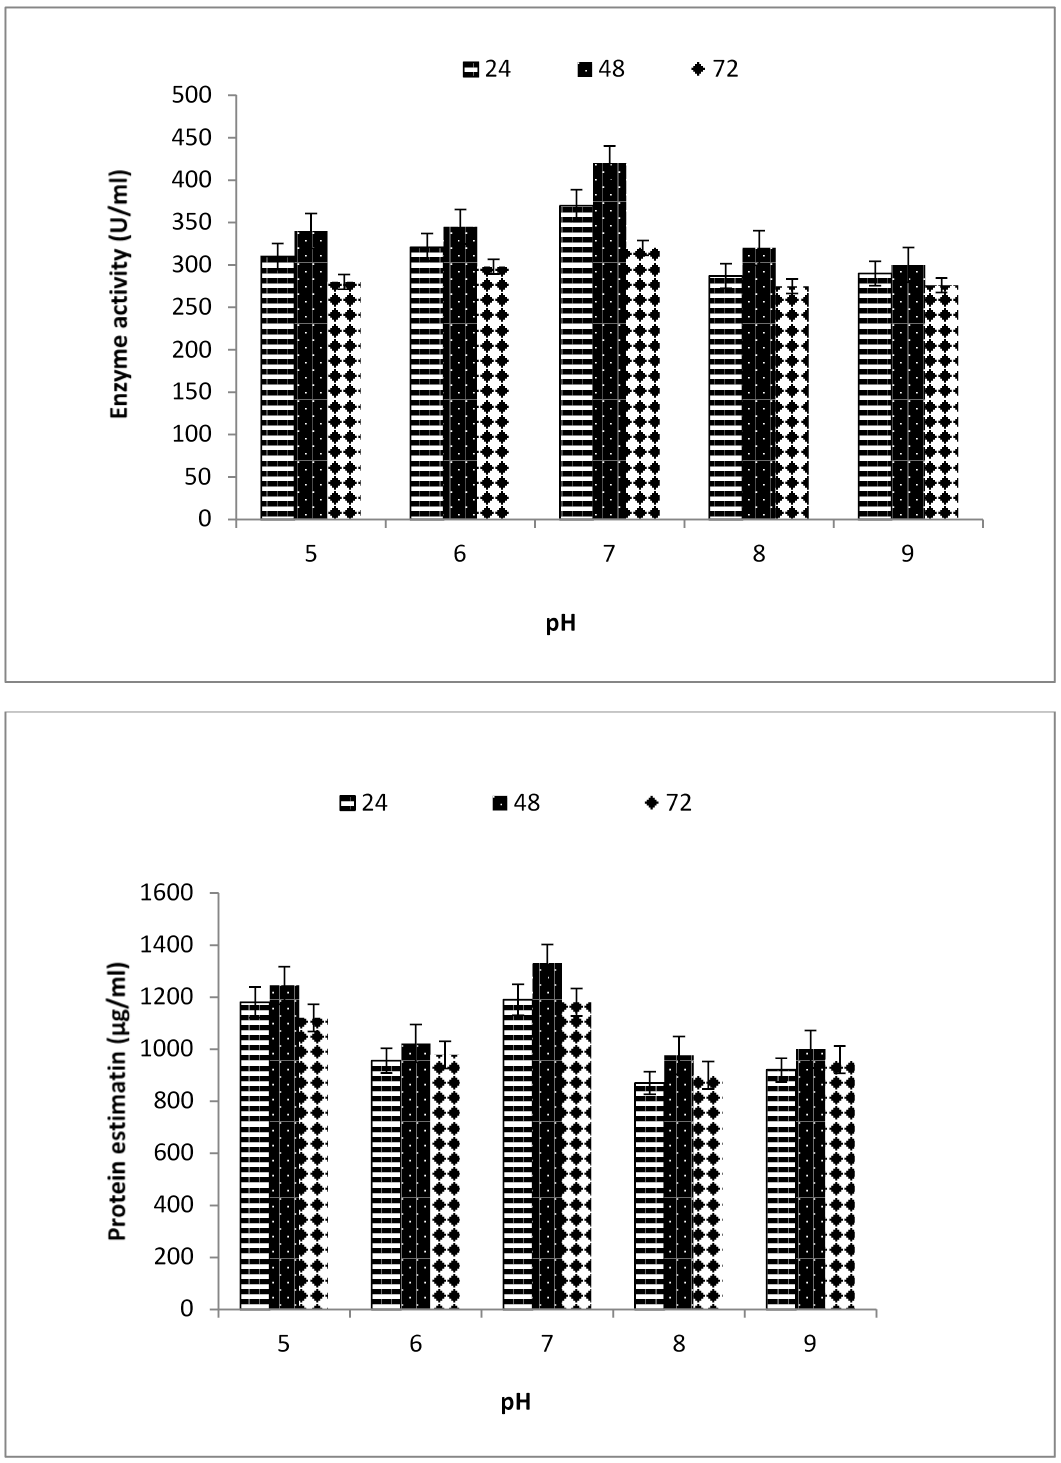
Effect of pH and protein estimation on keratinase production of Bacillus cereus FD2.

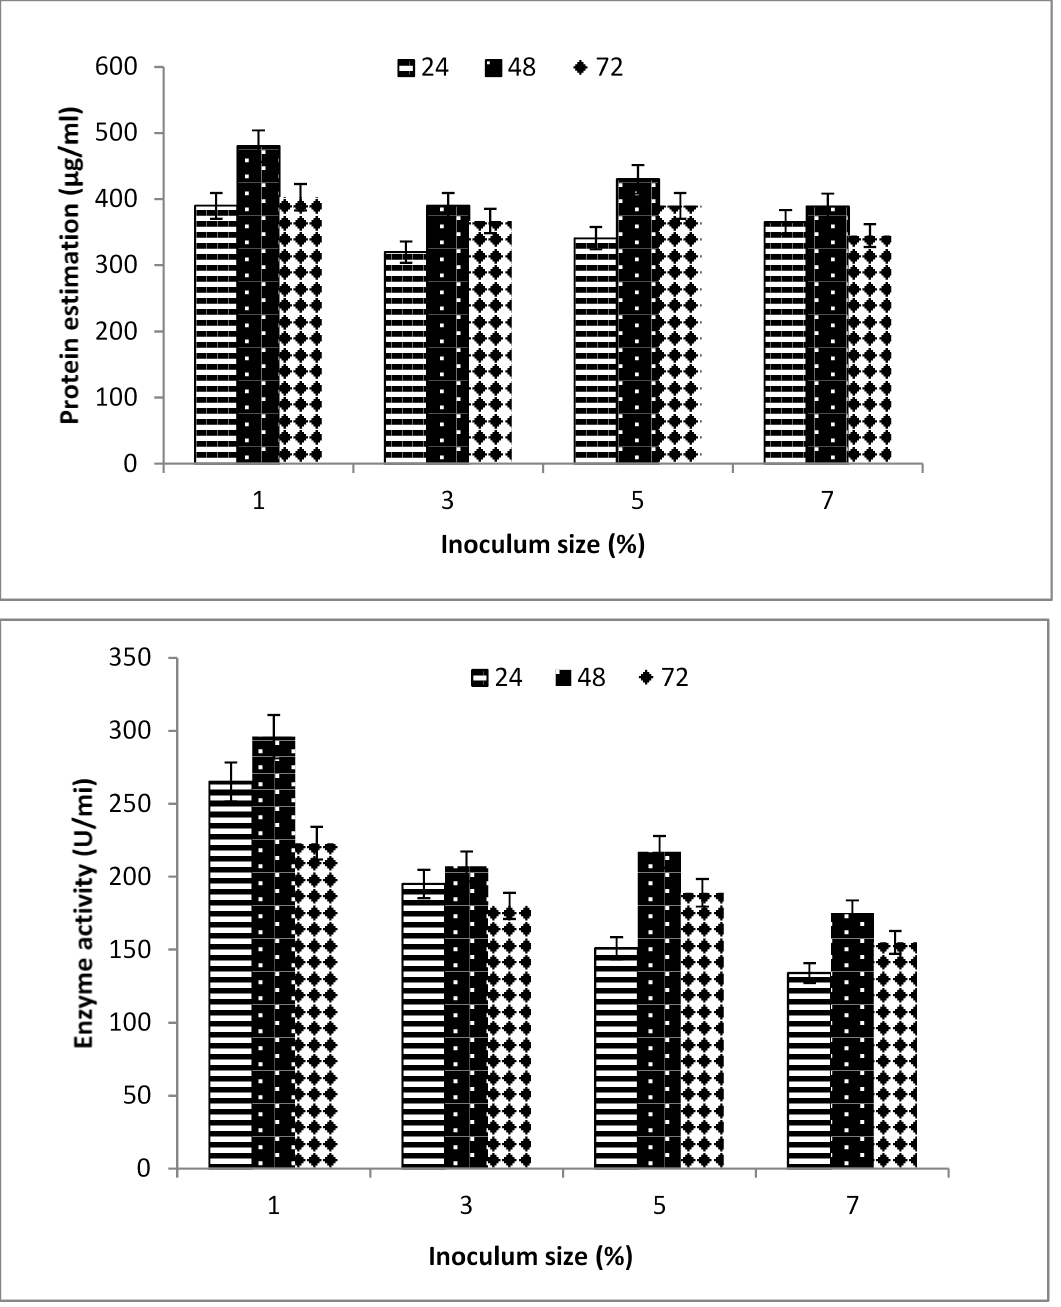
Effect of inoculums size on keratinase production and protein estimation by Bacillus cereus FD2.
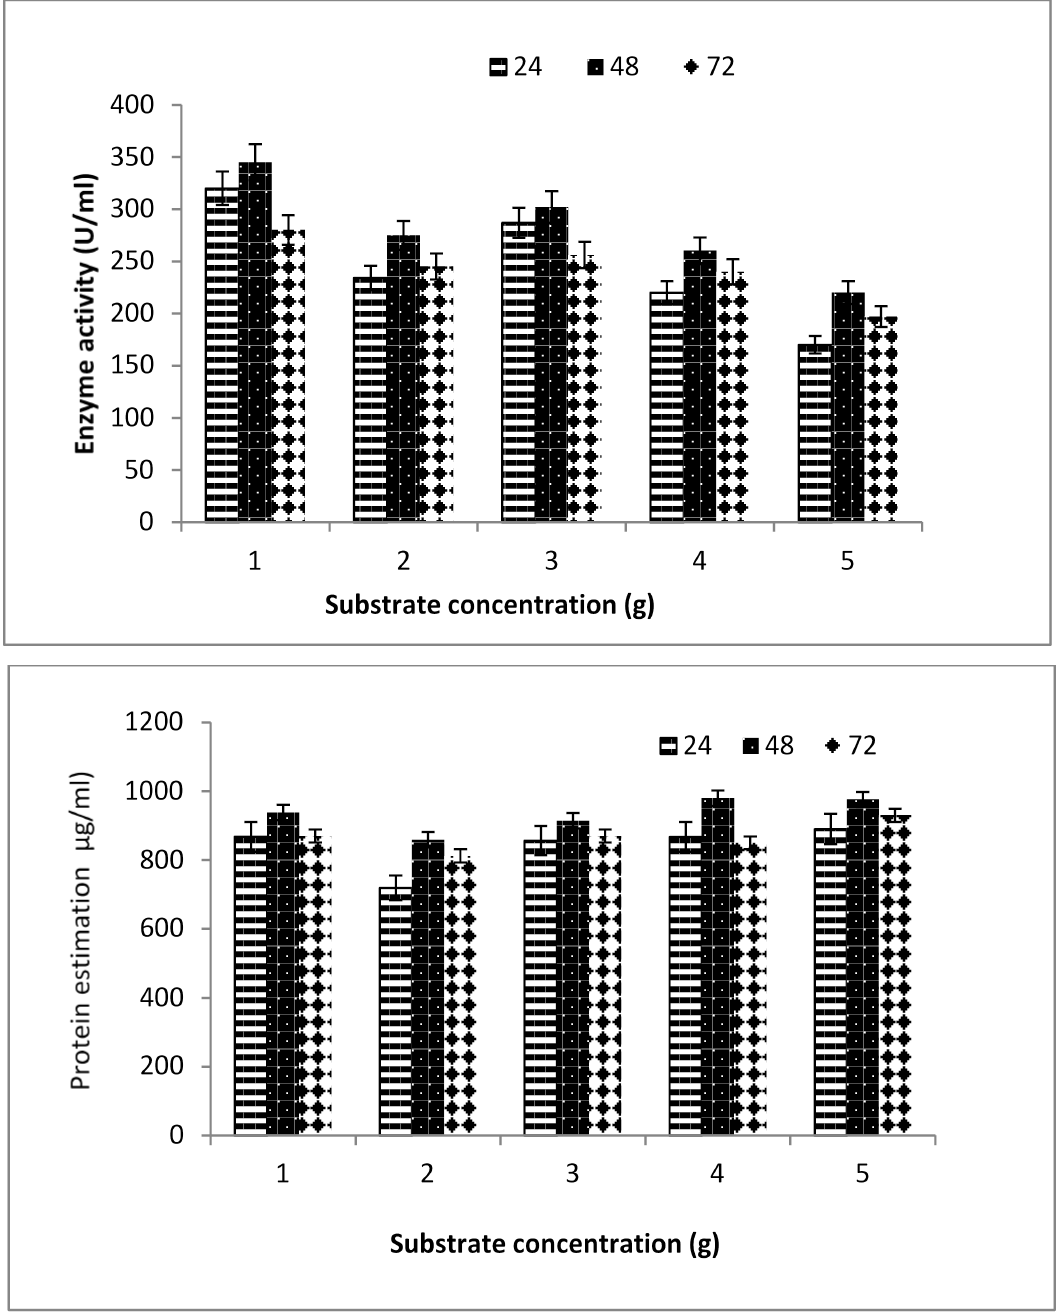
Effect of substrate concentration on keratinase production and protein estimation by Bacillus cereus FD2.
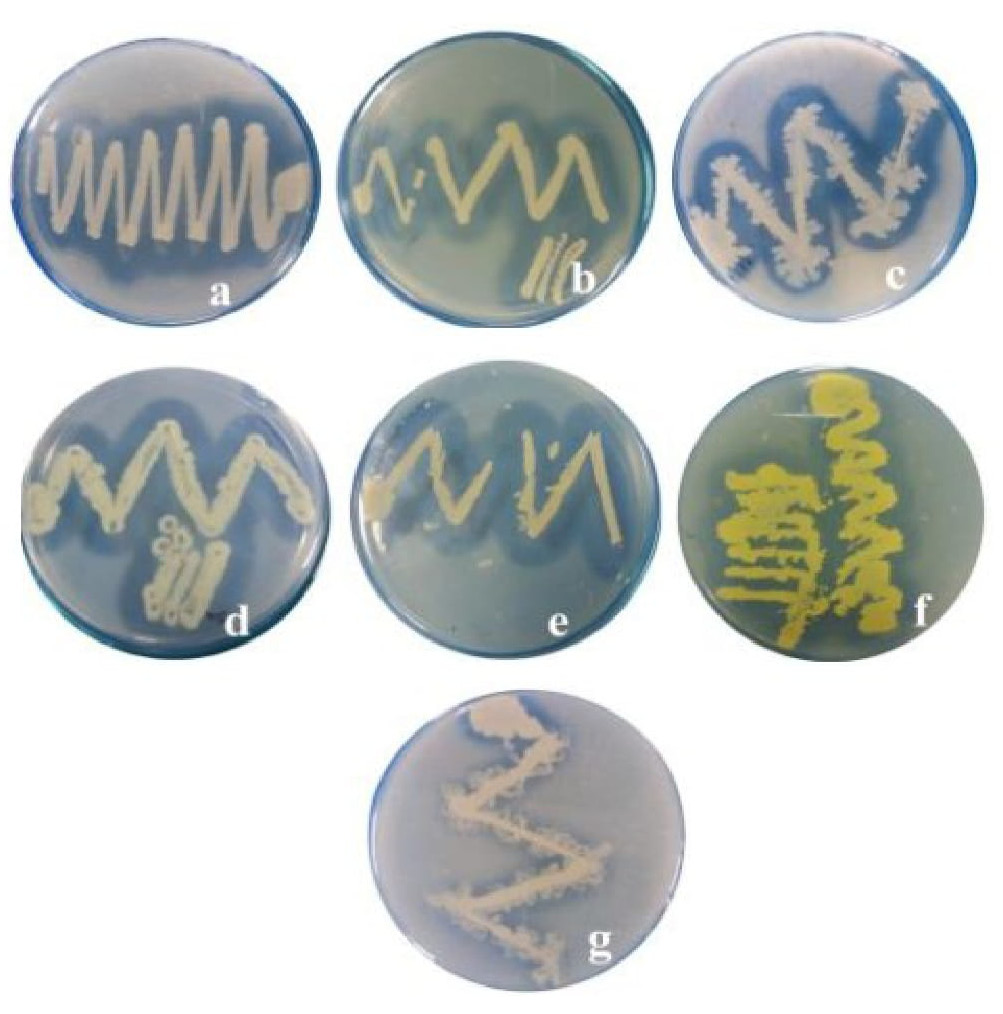
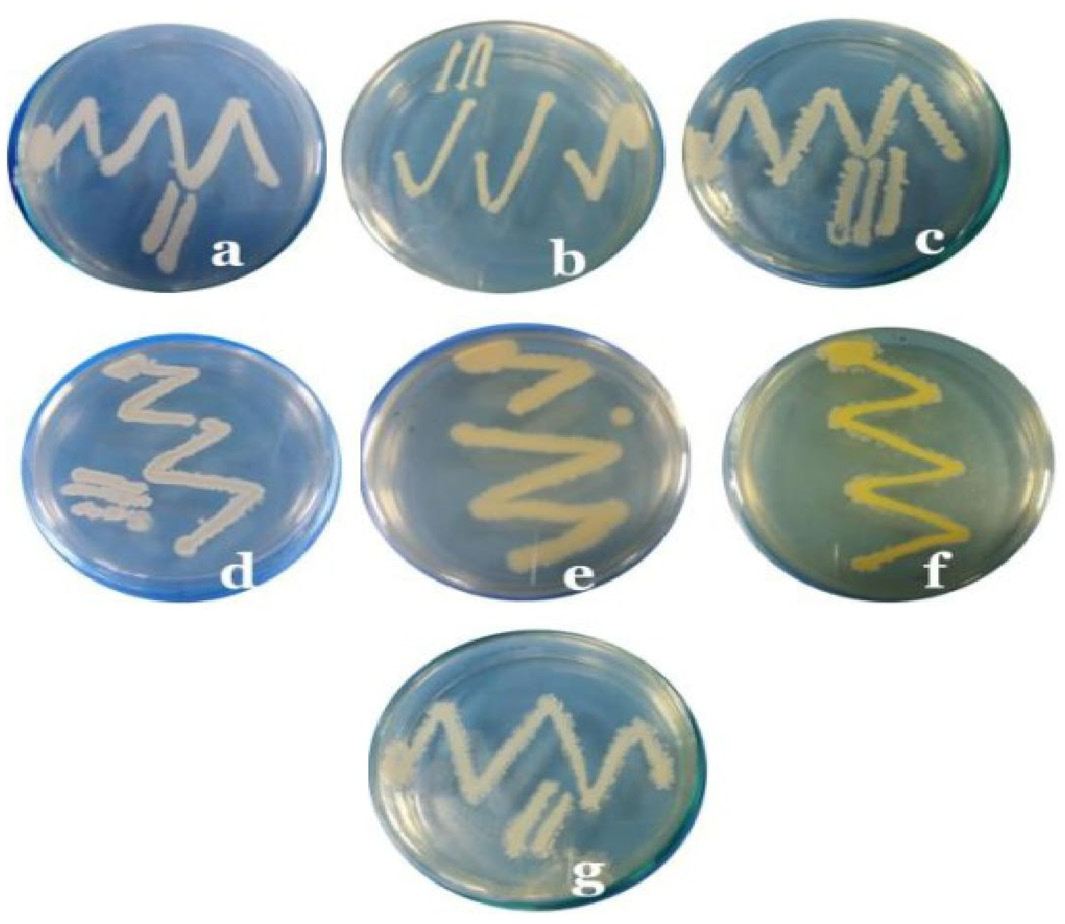
Primary screening of keratinase producing strains on skimmed milk agar plate after flooded with 10% Trichloroacetic acid demonstrated transparent zone of hydrolysis and identified as (a) Bacillus cereus (b) Bacillus altitudinis (c) Bacillus subtilis (d) Bacillus velezensis (e) Bacillus flexus (f) Bacillus alcaligenes and (g) Bacillus licheniformis.
